Excel’s TRIMMEAN() function can be quite useful at removing outliers, essentially it removes the top and bottom Nth percent of values and then computes the mean of the rest. Here’s the equivalent formula in Tableau that in Superstore Sales computes the TRIMMEAN() of sales at the customer level removing the top and bottom 5th percentile of customers when used with the AVG() aggregation:
{FIXED [Customer Name]: SUM(
    IF {FIXED [Customer Name] : SUM([Sales])} <
    {FIXED : PERCENTILE({FIXED [Customer Name] : SUM([Sales])}, .95)}
    AND {FIXED [Customer Name] : SUM([Sales])} >
    {FIXED : PERCENTILE({FIXED [Customer Name] : SUM([Sales])}, .05)} THEN
       [Sales]
    END)
}
Read on for how to build and validate your own TRIMMEAN() equivalent in Tableau.
![]()
When building out calculations in Tableau I try to let Tableau do as much of the computation as possible for both the calculations and the validation, so I’m typing as little as I can. Starting with Superstore, let’s identify the top and bottom 5th percentiles, here’s a view using a reference distribution:

Now we know what we’re going to have to remove. The next step is to duplicate this worksheet as a crosstab, then build out calcs that can return the 5th and 95th percentiles of Sales at the Customer Name level. While this can be done with table calculations (here’s an example from the Tableau forums) I’m going to use FIXED Level of Detail Expressions so I’ve got a dimension I can use, so for example I could compare the trimmed group to the non-trimmed group. Here’s the 95th percentile Level of Detail Expression:
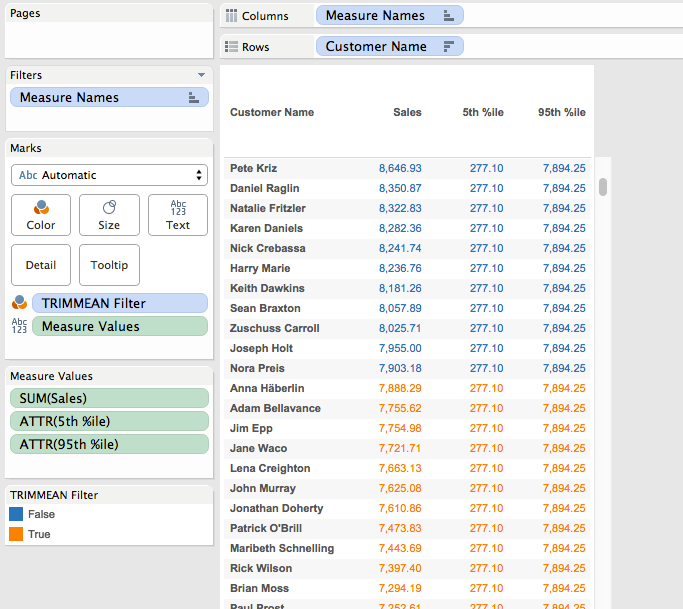
{FIXED : PERCENTILE({FIXED [Customer Name] : SUM([Sales])}, .95)}The inner LOD is calculating the sales at the Customer level, then the outer LOD is returning the 95th percentile as a record level value. Here’s the two calcs which have values that compare to the reference lines above:

The next step is to filter out the values outside of the desired range, here’s the TRIMMEAN Filter formula:
{FIXED [Customer Name] : SUM([Sales])} <
    {FIXED : PERCENTILE({FIXED [Customer Name] : SUM([Sales])}, .95)}
AND {FIXED [Customer Name] : SUM([Sales])} >
    {FIXED : PERCENTILE({FIXED [Customer Name] : SUM([Sales])}, .05)}
This uses the 5th and 95th percentile formulas and only returns True when the Customer level sales is less than the 95th percentile or greater than the 5th percentile, we can visually validate it by dropping it on the Color Shelf:

Now that we have this the next step is to calculate what the trimmed mean would be. Again, we can use a view with a reference line, this time it’s been filtered using the TRIMMEAN Filter calc and the reference line is an average:

Now we can embed the TRIMMEAN Filter formula inside an IF/THEN statement to only return the sales for the filtered values, this is the Trimmed Sales calc:
IF {FIXED [Customer Name] : SUM([Sales])} <
   {FIXED : PERCENTILE({FIXED [Customer Name] : SUM([Sales])}, .95)}
AND {FIXED [Customer Name] : SUM([Sales])} >
   {FIXED : PERCENTILE({FIXED [Customer Name] : SUM([Sales])}, .05)} THEN
   [Sales]
END
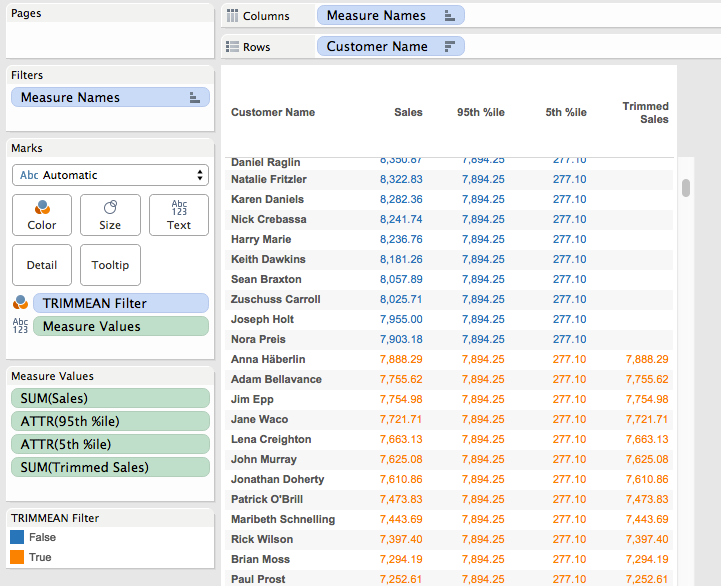
And here it is in the workout view, only returning the sales for the trimmed customers:

Now that we have the trimmed sales there are two ways we can go. If we want the trimmed mean without the Customer Name in the Level of Detail then we can validate that in our workout view by using Tableau’s two-pass Grand Totals to get the average of the customer-level trimmed sales. This was created by:
- Removing the TRIMMEAN Filter pill from Colors (this increases the vizLOD and is no longer necessary).
- Clicking on the Analytics tab.
- Dragging out a Column Grand Total.
- Right-clicking the SUM(Trimmed Sales) pill on Measure Values and setting Total Using->Average.
Scrolling down to the bottom we can see that the overall trimmed mean matches of 2,600.79 matches the one from the reference line.

Note that we could have used the Summary Card instead, however using the Grand Total lets us see exact values.
There’s a problem, though, if we use the Trimmed Sales all on its own in a view it breaks, whether using SUM() or AVG():

The reason why is that the Trimmed Sales is a record level value and Superstore is at the level of detail of individual order items, but we’re trying to compute the trimmed mean across Customer Names. For the true trimmed mean in this case we need to aggregate this trimmed sales to the Customer Name like we did in the workout view, here’s the Trimmed Sales (Customer Level) formula that uses the Trimmed Sales and wraps that in an LOD to get the Customer Level sales:
{FIXED [Customer Name]: SUM(
    IF {FIXED [Customer Name] : SUM([Sales])} <
    {FIXED : PERCENTILE({FIXED [Customer Name] : SUM([Sales])}, .95)}
    AND {FIXED [Customer Name] : SUM([Sales])} >
    {FIXED : PERCENTILE({FIXED [Customer Name] : SUM([Sales])}, .05)} THEN
       [Sales]
    END)
}
This returns the same results in the workout view:

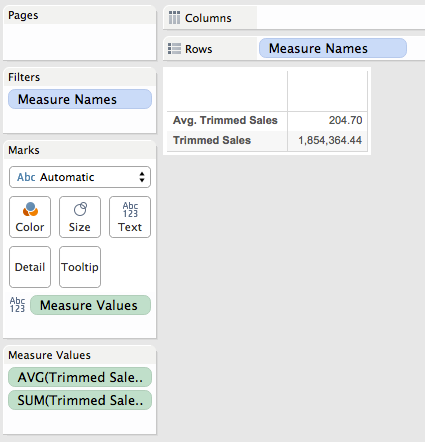
And works all on its own in a view:

Now this is a case where the FIXED level of detail expression is returning different results depending on the level of detail of the view, if we want it to return the same result then we can wrap all that in one more LOD expression, this is the TRIMMEAN Fixed calculation:
{FIXED : AVG(
    {FIXED [Customer Name]: SUM(
        IF {FIXED [Customer Name] : SUM([Sales])} <
        {FIXED : PERCENTILE({FIXED [Customer Name] : SUM([Sales])}, .95)}
        AND {FIXED [Customer Name] : SUM([Sales])} >
        {FIXED : PERCENTILE({FIXED [Customer Name] : SUM([Sales])}, .05)} THEN
            [Sales]
        END)
    })
}
And here it is in the workout view and a view without any dimensions:


Final Comments
This is a good (and bad) example of how Tableau is different from Excel. In one bad sense note that I didn’t parameterize the percentage for the trimmed mean, this is because in Tableau it would require two parameters because we can’t put calculations as the arguments to the PERCENTILE() function. In another bad sense the calculation requires understanding Level of Detail expressions and is not wrapped into a simple formula. On the other hand we’ve got very precise control over what the calculation is computing over with those Level of Detail expressions and aren’t just limited to doing trimmed means, we could do trimmed medians, get the Nth percentile of the trimmed values, etc.
Here’s the trimmed mean workbook on Tableau Public.


