Last Thursday 2014-12-04 at the Healthcare User Group virtual meeting I attempted to present an introduction to blinding and anonymizing healthcare data. Due to technical difficulties (the old “swap-machines-at-the-last-moment-then-have-to-upgrade-webex-software-right-as-the-network-goes-down” problem) I wasn’t able to complete the presentation, so I recorded it, it’s now available at http://vimeo.com/113666870.
Southern Maine Health Care has an opening for a data analyst in Quality Management. Or, to put it another way, you’d get to be in the office sitting next to me, see lots of arts & crafts from my daughter and hear me brag about her gymnastics exploits, eat amazing desserts, learn all of my Tableau tricks, and hopefully teach me some new ones.
Seriously, though (well, I am serious about teaching and learning and my officemates are fantastic bakers), what we’re up to is improving patient safety and quality of care. On a daily basis I get to help people who save lives, and I work with an awesome team of doctors and nurses who are passionate, dedicated, smart, and really appreciative of the assistance I give them in analyzing and understanding data. Being a non-profit system in a changing environment, you’re not going to get a big Silicon Valley or Wall Street salary here, so there’s a tradeoff. That said, Maine doesn’t have Silicon Valley’s cost of living either, and there are a whole lot of plusses besides to tempt you to work in this northeast corner of the US. Here are some of my favorites:
We’re on the coast, yet there are mountains, lakes, and a lot of woods close by. We get all four seasons (gorgeous falls, snow in winter, mud in spring, and hot muggy summers), and as long as you subscribe to the adage “There’s no such thing as bad weather, only the wrong clothing.” you can have a great time swimming, sailing, skiing, hiking, biking, etc.
Pace of life. Compared to big cities and their ‘burbs life runs a bit more slowly here, which suits me.
Architecture. The old mill towns have amazing construction and details, and the old farmhouses with their “Big House, Little House, Back House, Barn” design (I live in one) are a fascinating mix of form and function. (As well as many opportunities for learning home repair & improvement skills).
The data analyst posted position doesn’t have many details, here are some more: The core skill set we’re looking for includes the key data analyst skills – curiousity, the ability to listen and learn, the right amount of “data OCD” for identifying outliers/trends/problems and the drive to figure them out, plus the ability to formulate questions, find answers, and present conclusions. Having SQL skills or being great at Excel and ready to learn SQL are necessary, along with a willingness to use Tableau (no prior Tableau experience is required). Beyond those must-haves, one or more of the following would be great: experience in healthcare quality metrics, financial analysis (particularly as it applies to healthcare), scripting & coding (Python & JavaScript preferred), database design, data visualization & dashboard design, statistical analysis, and/or process improvement (Lean, Six Sigma, etc.)
The set of tasks is pretty varied: You would be working to integrate new data sources and new metrics (we have over 110 active data sources tracking over 1000 metrics), find ways to improve efficiencies in quality management and beyond, and be responsible for a set of regularly-updated dashboards and reports, and have opportunities to redesign them to improve communication. A key goal in the next year is to find & develop ways to get more information out sooner throughout the organization.
Organizationally, SMHC is the largest employer in York County and a local institution. This is a different model from a start-up environment, here we get the job done, work our hours, and get to go home. Overall, Maine hospitals are the best in the country at quality and patient safety; we’re part of that, and the goal is to get even better. As an integrated healthcare system including two hospitals and over a dozen outpatient physician offices we’re big enough to have a variety of interesting problems, yet small enough that one person can have influence. Within weeks of starting you’d be presenting analytics to front line clinicians and/or senior management. A core challenge we are dealing with is working out how we can transition healthcare in our area from an ultimately unsustainable payor and delivery model to something more sustainable while increasing patient safety, quality of care, and improving how we do our jobs, and that’s part of why I’m here.
If you’re interested in this job, feel free to contact me at jonathan (dot) drummey (at) gmail or directly apply.
The Superstore Sales data that ships with Tableau makes life seem so easy: Numbers like Profit and Sales that go up, up, and up. But we don’t only measure things by how high they go, but also how low. Working with hospital quality data, we have small numbers like infection rates that we want to get even smaller. We have rates like the percentage of patients who receive aspirin on arrival that we want to get larger. And then there are measures like how many medication error events are reported that we of course want to get smaller, but we wouldn’t trust if that number got too small too soon because it might indicate under-reporting. Tack on situations like hospital units that may go for months or years without having any events (but are still mandated to report), data arriving at different times, and a variety of units with differing numbers of decimal places, and putting everything on one dashboard gets a wee bit complicated.
This is a process post about how I solved this problem for a hospital quality dashboard with some brilliant help, a dose of calculated fields, and a number of iterations. I presented this dashboard at the Tableau Customer Conference last month, and offer up this post as a a contribution to Tableau Design Month.
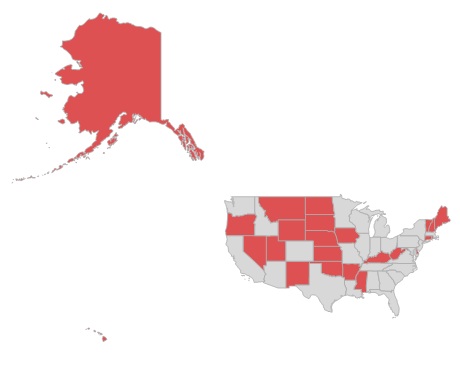
For my entry for the Tableau Interactive Political Viz Contest, I chose to create an infographic that reframes the healthcare debate in terms of a moral question: Who are we choosing to deny health coverage to? Or, more specifically, who would you deny health coverage to?