Since Tableau v9.0 or so every new release has come with new features that simplify and reduce the amount of data prep I have to do outside of Tableau. Pivot in version 9.0, the first batch of union support in v9.3, support for ad hoc groups in calculations, cross data source joins and filters in v10.0, and more in-database unions and join calculations in v10.2. With the join calculations we can now do unions and cross/cartesian joins within or across almost any data source without needing Custom SQL or linked databases and without waiting for Tableau to implement more union support, read on to learn how!
Here are some use cases for unions across data sources:
Union data that is coming from different systems, for example when different subsidiaries of an organization are using different databases but you want a single view of the company.
Union actual sales data from transactional systems and budget data that might come from an Excel spreadsheet.
Union customer & store/facility data sets so you can draw both on the same map.
This post goes through examples of all three using a combination of text files and superstore, and Rody Zakovich will be doing a post sometime soon on unions and joins with Tableau data extracts. (Did you know you could do cross data source joins to extracts? That capability came with v10.0, and we can have all sorts of fun with that using join calculations!)
We’ll talk about Sets in a bit, first we need to do a little forep discuss another one of the new features in Tableau v9.2: Min and Max for Booleans.
This post is the third in a series on new features in Tableau 9.2. It covers unannounced features in a version of Tableau that hasn’t been released yet so the features discussed here may change prior to release, especially if the folks at Tableau get a headache over my Sets puns.
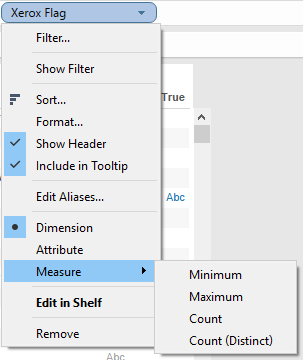
In Tableau v9.1 and earlier we can only aggregate Boolean fields to do a Count or Count (Distinct). Here I’ve created a Xerox Flag calculated Boolean dimension with the formula CONTAINS([Item], 'Xerox') to identify all order items that include Xerox in the name:
Tableau 9.2 adds MIN(), MAX(), and ATTR() as aggregation options that have a number of impacts on what we can do in Tableau. Read on to find out!
New Aggregations for Booleans
Here’s the new context menu for a Boolean dimension in v9.2 using that same Xerox Flag showing Attribute, Minimum, and Maximum have been added:
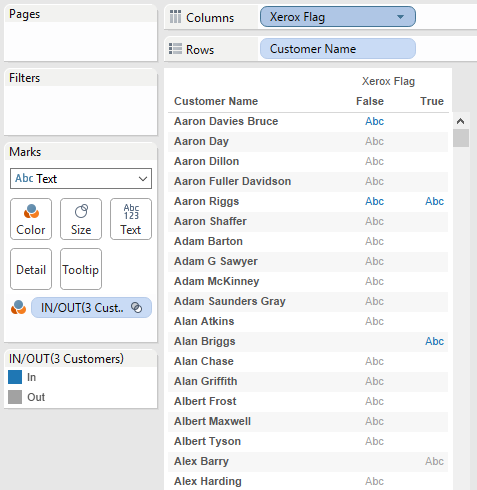
To help show what the new aggregations do let’s start out with this screenshot with Customer Name and Xerox Flag as dimensions, in particular the three rows with blue Abc marks indicating there is data:
Aaron Davies Bruce (Bruce) who only has False as a value for Xerox Flag indicating that he has only purchased non-Xerox item(s).
Aaron Riggs (Riggs) who has both True and False, so he’s purchased both.
Alan Briggs (Briggs) who has only True, so he’s only purchased Xerox item(s).
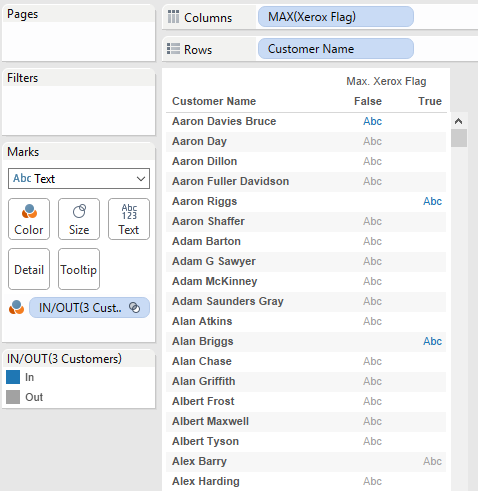
If I aggregate Xerox Flag as MAX(Xerox Flag) then we see that:
Bruce has False because he has only the one value for Xerox Flag.
Riggs has only True, because the max of True and False is True.
Briggs has True because he has only the one value for Xerox Flag.
If I aggregate Xerox Flag as ATTR(Xerox Flag) then we see:
Bruce has False because he had only the one value for Xerox Flag.
Riggs has * because he has both True and False.
Briggs has True because he had only the one value for Xerox Flag.
What can we do with these new aggregations of booleans? Here are some ideas:
Filter by Discrete Aggregate
In an earlier Feature Geek post I’d described how in 9.2 we can filter by a discrete aggregate. We can put MAX(Xerox Flag) pill onto the Filters Shelf, filter for True, and boom we’ve got only those customers who have purchased one or more Xerox items–including Riggs and Briggs:
There is still one limitation here, we can’t drop ATTR(Xerox Flag) from a primary data source onto the Filters Shelf:
I suspect the reason why has to do with ATTR() being a special aggregation computed in Tableau whereas MIN(), MAX(), COUNT(), and COUNTD() are all computed in the data source.
However, when using data blending we can put ATTR(secondary dimension) on the Filters Shelf because of how data blending works – many aggregate filters on secondary sources are generally computed in Tableau, not in the data source, so Tableau already has that ability to filter on ATTR(secondary dimension). Here’s an example using Xerox Flag from a duplicated secondary source:
In v9.1 and earlier if we had a Boolean dimension and wanted to use it to create a cohort then we had to do an extra step that was often confusing to new users. For example if we want to only return Customers who have purchased a Xerox item we’d build a Conditional Filter using a By Formula: calculation like SUM(IF [Xerox Flag] THEN 1 ELSE 0 END) >= 1:
The inner IF statement is evaluated for every row and returns 1 or 0, then those results are summed up for each Customer and then if that aggregated result is >= 1 then the Customer is returned:
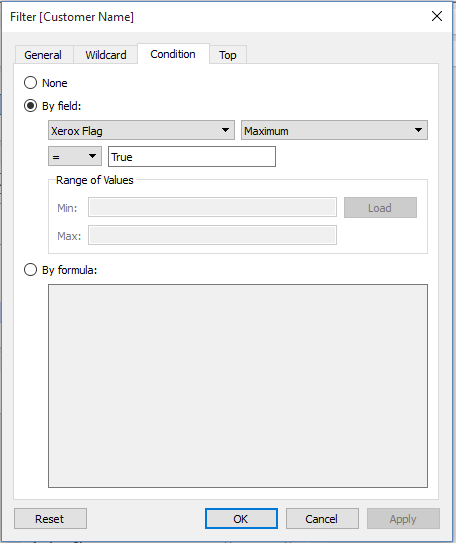
Having MAX() as an aggregation for a Boolean lets us get rid of the indirection of the SUM(IF… calculation and most of the typing as well since we can now specify the aggregation in the By Field: section of the view. All I had to do for this filter besides mouse clicks was type in “True”:
That is quite a bit easier to describe to new users!
Boolean Dimensions from Secondary Sources in the View
In v9.1 and earlier we couldn’t place Boolean dimensions from secondary sources in the view. Here in v9.1 I’ve duplicated Superstore and I’m trying to use the Xerox Flag from the secondary as a dimension and Tableau isn’t letting me drop it on Columns:
The reason why is that “under the hood” Tableau effectively treats dimensions from secondary sources as ATTR(dimension) — that’s why we get * for dimensions from secondary, see my 2014 Tableau Conference session on Extreme Data Blending for more details. In v9.1 and earlier Tableau does not support ATTR(boolean dimension) so we couldn’t drop the boolean. I already demonstrated above how we can use ATTR(secondary dimension) as a filter, and in v9.2 now we can directly use secondary boolean dimensions in the view, here’s the Xerox Flag boolean:
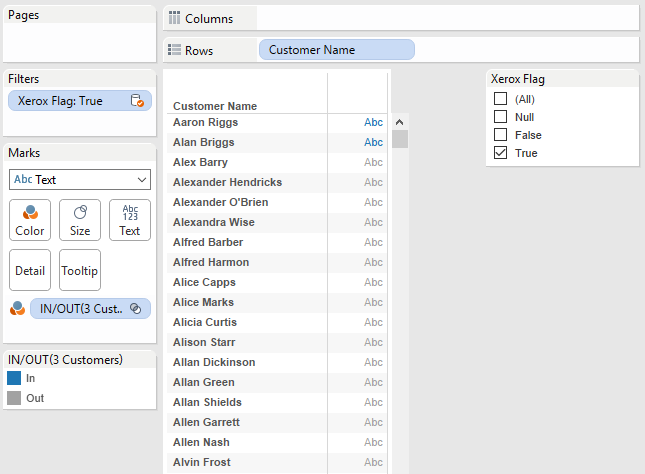
And we can use that Xerox Flag boolean dimension from the secondary as a filter:
Sets with Your Secondary (9.2 Style)
Awhile back I wrote a post on how to use Sets from secondary data sources. You see, ordinarily we can’t drag in a Set from a secondary data source, they are greyed out:
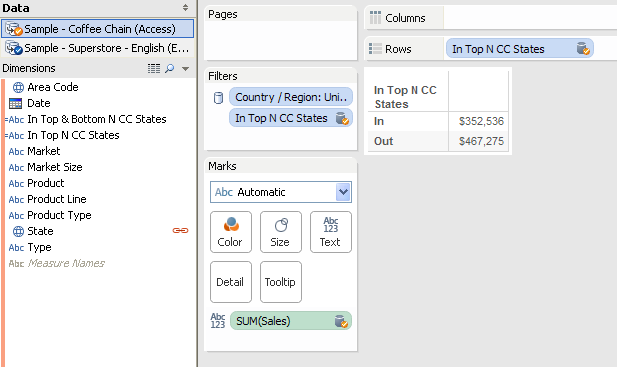
The workaround I’d come up with was a) to create a calculated dimension in the secondary source based on the Set that b) converted the boolean True/False of the Set into text or numbers that could be used as a dimension filter. For example this formula turns the Top N CC States Set from Coffee Chain into a calculated field of a usable data type:
And then the calc can be placed in the view, filtering for “In”:
Step b) was necessary because Tableau would not let us directly use a dimension with the Boolean data type from the secondary. With Tableau v9.2 we get a little closer to being able to have Sets w/out interruption use Sets more directly. We still need step a) convert the Set into a calculated dimension but we no longer need step b).
Here in v9.2 I’ve taken the Top N CC States Set and created a calculated Top N CC States Dimension field that has the formula [Top N CC States] so it’s just passing the boolean True/False into a calculated dimension:
And in v9.2 I can directly drop this calculated dimension as a filter:
So we can use Sets from secondary sources in v9.2 a little more easily than we could before.
Conclusion
Besides the big new features (Mapbox!!) Tableau continues to make iterative improvements in the ease of use of the software. Being able to aggregate booleans using MIN(), MAX(), and ATTR() just like we can other dimensions takes away the mental friction introduced by having to remember the data type every time we want to aggregate.
Tableau Public is running v9.2 already and you can see the aggregated booleans workbook and download it to your v9.2 beta. (If you’re not running the beta, you can get it by contacting your Tableau sales rep).
What’s New in Tableau 9.2?
Roughly two weeks after the public release of Tableau 9.2 I’ll be doing an online training on all the new features in Tableau 9.2 Desktop – this post is a sample of what you’ll be seeing in the course, a combination of how the feature works, where the edges are and how you might use it. Sign up below to get more info when the course is available!
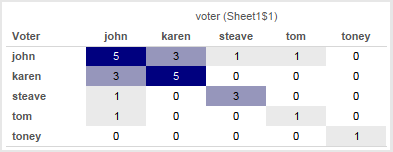
This is another post inspired by a Tableau forums thread. Given a set of survey data that is in a “tall” format with a record for each voter & item (survey question) with their vote the goal is to end up with the sum of matching votes for each pair of voters. So if John & Karen both voted ‘yes’ on the same question that would count as 1 for that question, and then all other matching votes for the questions that John & Karen answered would be totaled up and that number put in a cell for the combination of John & Karen, like so:
The easiest way to do this would be using a join; however the data is from an OData source and those don’t support joins. Also data from OData sources has to be extracted and Tableau doesn’t currently support joining across extracts. The original poster indicated that doing any ETL wasn’t possible, the desire is to have everything just work in Tableau. So we turn to some alternatives, read on for how to build this with and without joins.
Approach
The way I approach this kind of problem is first to understand the goal and understand the data. The data seems pretty clear, and the goal is to end up with a matrix defined by the voter on Rows & Columns. So however many records there are in the data we want to see N^2 values where N is the number of voters. Given that the data source is OData (so no custom SQL) my first thought was to use the No-SQL Cross Product via Tableau’s data densification. That would requiring densifying both the voters (to make the matrix) and the items (to do the comparisons for each voter/item) and my initial attempts got way too complicated way too quickly so I bailed out on that. I came up with a slightly modified solution involving Tableau data blends, however I’m going to go through this first using a join-based solution because it’s easier to describe some of the subtleties involved (plus that will work for many data sources) and then the second time around with the blend-based solution
Join Solution
In this solution I set up the data so it has everything we need – all the combinations of votes and voters – then all we need to do is count records. Since we want to set up pairs of voters for each item, I set up a self-join on item:
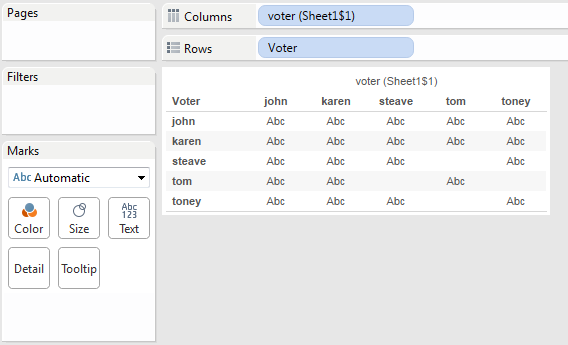
This gets us the 47 combinations of voters & votes in the data. Now we can set up a view with the Voter dimensions from the original and the join:
Note that there are some empty cells here: the pairs Tom & Steave and Tom & Toney didn’t vote on any of the same items at all. We’ll come back to this later.
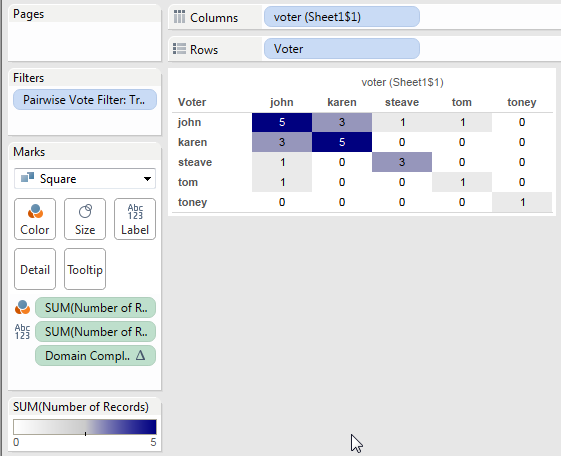
We only want to count voters that had the same vote, so the following Pairwise Vote Filter calc will return only those votes:
[Vote] = [vote (Sheet1$1)]
With that on the Filters shelf, we can set up a view using SUM(Number of Records):
There’s a bunch of empty cells here, what if we want 0’s to show? We can use Format->Pane Tab->Special Values->Text, but that will only work where there is data and we know there are some cells that don’t have data. To get those cells to be marks we can take advantage of Tableau’s domain completion by having a table calculation address on one of the voter dimensions.
We can use a simple table calculation like INDEX() (the field is called Domain Completion Trigger) and the default Compute Using of Table (Across) will address on the voter (Sheet1$1) dimension, padding out the marks:
With that in place we can now build the final view for the join. I set Format->Pane tab->Special Values->Text to be 0, changed the Mark Type to Square, edited the color to use a custom diverging palette (starting at 0), and turned off “Allow labels to overlap other marks” to have Tableau auto-swap the text color so the darker cells have white text:
So the data didn’t have quite all the granularity that we needed for display and we had to turn on data densification with a table calculation to pad it out. In the next section we’ll use Tableau’s ability to do even more padding.
Blend Solution
This uses a different approach. In this case, we set up the view so it has all the marks that we need (but not quite all the marks we’d want), blend in the data for the each half of a pair of voters and then use calculated fields to compute across the data and “paint” the right values into the marks. It uses the original data as a primary source and then the domain completion technique outlined in the No-SQL Cross Product post to effectively get the necessary marks, then uses two self-data blends to get the comparison data that take advantage of the fact that Tableau data blends are computed after densification. For more information on that, see the Extreme Data Blending session from the 2014 Tableau Conference. https://tc14.tableau.com/schedule/content/1045.
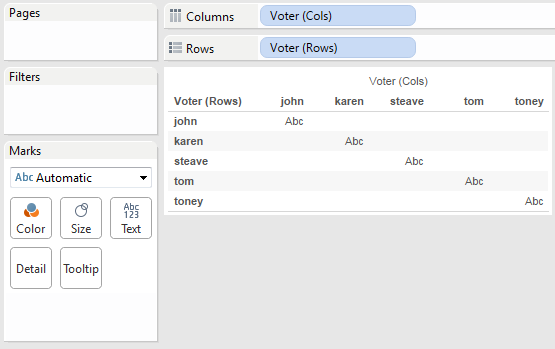
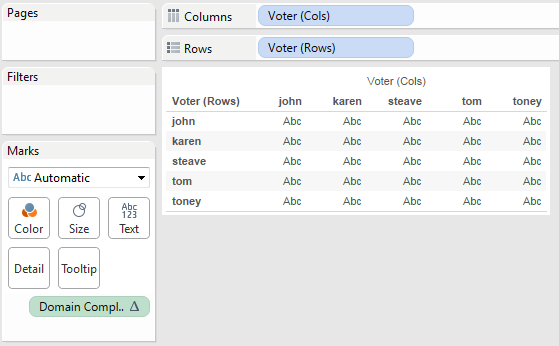
Starting out I duplicated the Voter twice, naming one Voter (Rows) and Voter (Cols), then put those on Rows and Columns, respectively. We only see the 5 marks for the 5 voters:
Then we can use the same INDEX() calc to trigger domain completion:
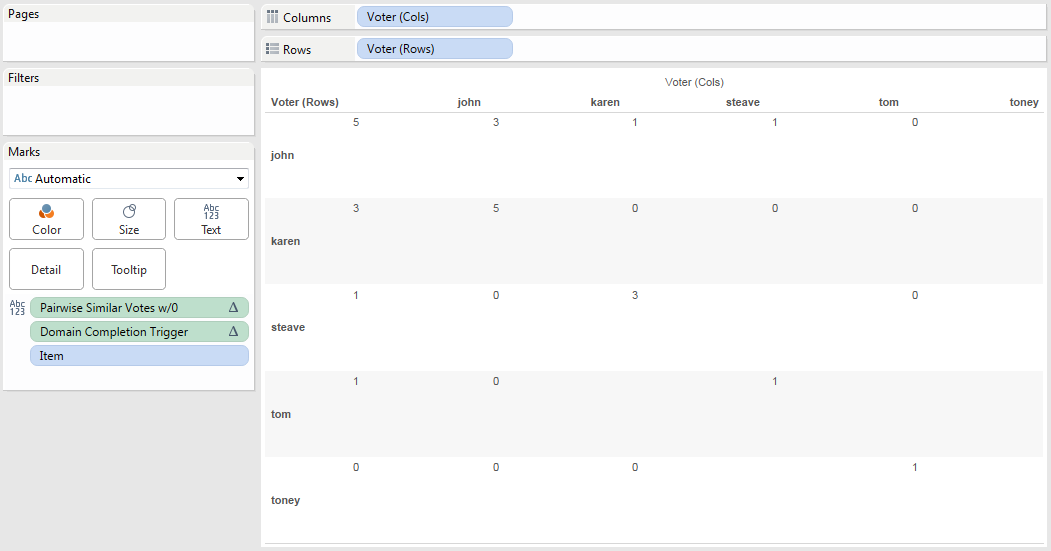
We need to do the comparison at the level of voter *and* item, and for Tableau to compare across data sources the comparisons have to be done as aggregates, so that means that item has to be in the view. When we add Item to the view what we’re seeing in each cell is a mark for each time the the voter on Rows and Voter on Columns both had votes for the same Item. There are 47 marks here, just like the 47 rows we got from the self-join solution.
A problem here is that we lose some of the domain completion, we’ll work around that. (Where I’d tried to start was to do the second set of densification necessary domain complete on Item as well, but that got too complicated.)
The view just got a lot bigger here, that’s because of Tableau’s mark stacking behavior. We’ll fix that later with a table calculation filter.
Now we can set up a couple of self-blends by first duplicating the data source twice. It’s also possible to duplicate the data connection only (for example by directly connecting to the extract), however that requires more effort to set up. I named the duplicated sources Rows and Cols, and in each created calcs for Voter (Rows) and Voter (Cols), respectively. Then I could add in the Vote fields from each source and Tableau automatically blends the Rows source on Item, Voter (Rows) and blends the Cols source on Item, Voter (Cols). If I hadn’t named the fields the same then I could have used Data->Edit Relationships… Here’s a view showing for each voter pair the vote (Item), the votes from Rows, and votes from the Cols source:
This view lets us see what votes line up with what. So in row karen/column john, we can see that they both voted for items 21, 25, and 32, and had the same votes for each.
The next step is to build a test calculation for the view. Here’s the formula for Pairwise Similar Vote Test:
IF ATTR([blend Sheet1 (test_voting) (rows)].[Vote])
 == ATTR([blend Sheet1 (test_voting) (cols)].[Vote]) THEN 1 ELSE 0 END
We’re using ATTR() as an aggregation because a) that’s the default and b) we are comparing fields from two different sources and Tableau requires them to have some sort of aggregation applied.
In the view, we can see that the calculation is working accurately:
The Vote dimensions from the secondary are useful for checking the calcs, but they aren’t needed at this point so we can get rid of them:
Now to count up the votes in each cell. Here’s the Pairwise Similar Votes w/0 table calculation:
IF FIRST()==0 THEN
    WINDOW_SUM(IF ATTR([blend Sheet1 (test_voting) (rows)].[Vote])
      == ATTR([blend Sheet1 (test_voting) (cols)].[Vote]) THEN 1 ELSE 0 END)
END
This has a Compute Using on the Item so it partitions on Voter (Cols) and Voter (Rows). The inner IF statement is our same calc, those results get summed across all Items in each partition, and then the IF FIRST()==0 returns only a single non-Null value in each cell. Here it is:
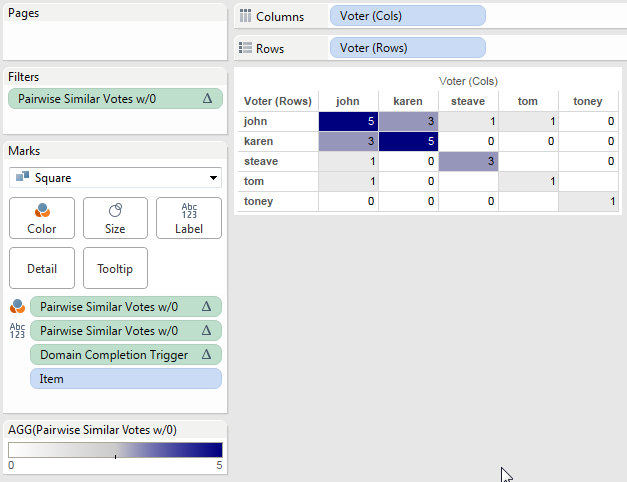
We can then duplicate that view, make the marks Square, duplicate the Pairwise Similar Votes pill to the Color Shelf, set up a custom diverging color, duplicate the pill again to the Filters shelf to set it to filter for non-Null values, and we end up with this:
There are those empty holes where there are no Items for Tom & Steave and Tom & Toney. There’s no way that I know of using this particular blend to fill them in, because Item has to be a dimension in the view the domain completion is limited. This might be useful in some cases, I also came up with an alternative.
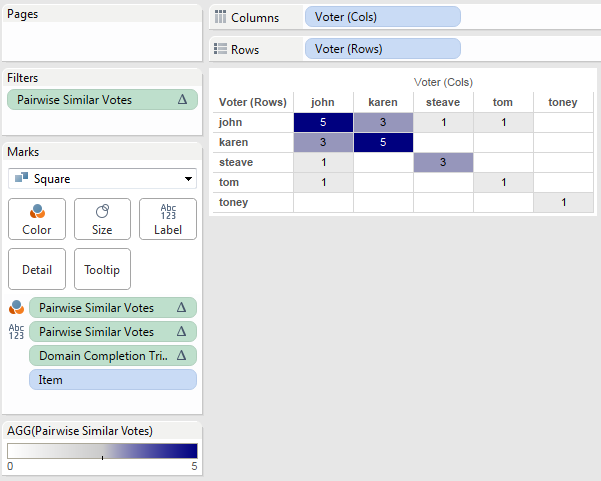
In this alternative instead of returning 0 when there are no pairwise similar votes the calc returns Null, here’s the revised Pairwise Similar Votes formula:
IF FIRST()==0 THEN
    WINDOW_SUM(IF ATTR([blend Sheet1 (test_voting) (rows)].[Vote])
      == ATTR([blend Sheet1 (test_voting) (cols)].[Vote]) THEN 1 END)
END
This has the same settings as the first, only now it won’t show any numbers. Then using the same process as before along with tweaking the color palette to start at 0 we can have a view that only shows where there are non-zero results, with white for everything else:
Conclusion
So there’s a couple of ways to go at this, the relatively easy way with a join and the more complicated way with the data blend. Personally, I’m in favor of voting up the Join Data from Different Sources feature request to allow joins across data sources, then even something like an OData source could be extracted twice and joined to create the desired view.
May I ask if it would be possible to get a detailed explanation of applying this principle to a different type of data?
For example, I would like to see the US Sales totals, and have the ability to filter it to a US state without the ability to select a US territory (Guam, Puerto Rico, etc), but to have the US territory sales remain in the US national totals. How could I do this?
In this short post I cover two different techniques how to do this using a self-data blend and LOD expressions, respectively.
Tableau Sets can turn incredibly complicated interactions into a few mouse clicks that can reveal patterns in your data. However, if you’ve ever created a Set in a secondary data source and tried to use it across a blend in a primary, this is what you see:
Lots of grayed out items that can’t be touched. It’s like you’re at a party and have just met the hot-babe-of-appropriate-gender-of-your-dreams and they are totally into you, but only at the party, and not back at your place.
However, like many things in Tableau, with a little creativity you can get what you need, and there is a way where you can have your Sets anywhere you want.
If you’re not familiar with sets, then I suggest you start with Hot. Dirty. Sets. That was the title of a great session on sets by Russell Christopher and Michael Kravec at the Tableau Customer Conference in DC last month, the session video is up at http://tcc13.tableauconference.com/sessions. In their presentation Russell and Michael plumbed the depths of bad puns and went through a number of use cases. If you’re not familiar with Tableau version 8 sets, definitely watch the video. If you didn’t got to TCC, I suggest you watch this (vanilla) Tableau On-Demand training video on sets.
For this post I’ll attempt to avoid any more jokes about sets and show you how you can get jiggy with use sets from blended secondary data sources, and probably learn a bit more about data blending on the way.
In this tutorial I’ll be using the Superstore Sales and Coffee Chain data that ship with Tableau, with the Superstore Sales as the primary, Coffee Chain as the secondary. The Coffee Chain data is an Access database, and Tableau uses Microsoft JET for the driver for Access, Excel, and text files (this will change somewhat in 8.2). Microsoft JET has more limited functionality than other database connectors, so the first step is to extract that data into Tableau’s data engine. That will enable us to use the IN/OUT of sets.
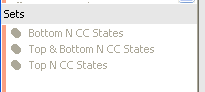
Then in the Coffee Chain database we create a set for the Top N States by Sum of Sales:
And here’s a view of that Coffee Chain data, where there are only 20 states:
But when we set up a view based on Superstore Sales and switch over to the Coffee Chain data, any and all sets are taboo greyed out:
However, we can use sets in calculated fields. The In/Out of a Set returns a boolean value, and here’s a simple formula used for the In Top N CC States calculated field:
IIF([Top N CC States],"In","Out")
This is treated as a dimension in the CoffeeChain data, which can lead to all sorts of applications, including using as a filter, color, or in additional calculated fields.
Note that in production, I’d probably use 1 and 0 as values instead of “In” and “Out” and then use aliases (because integers are faster than strings), and to solve a filter issue, however for this demo I’ll stick with In and Out to make it easier to understand and explain the filter issue further down.
Set from Secondary as Filter
Here’s a starting view from Superstore Sales as our primary data source:
Before putting the In Top N CC States on the Filter Shelf, though, in the Coffee Chain data click on State as a linking field:
Important note: whatever dimension(s) you use for the Set must be the blending dimension(s), no more and no less, if they are not then your results will be mighty strange. I’m still trying to work out what’s happening there. If you really need some calculation that blends on a different set of dimensions, then use a duplicated data connection for that blend.
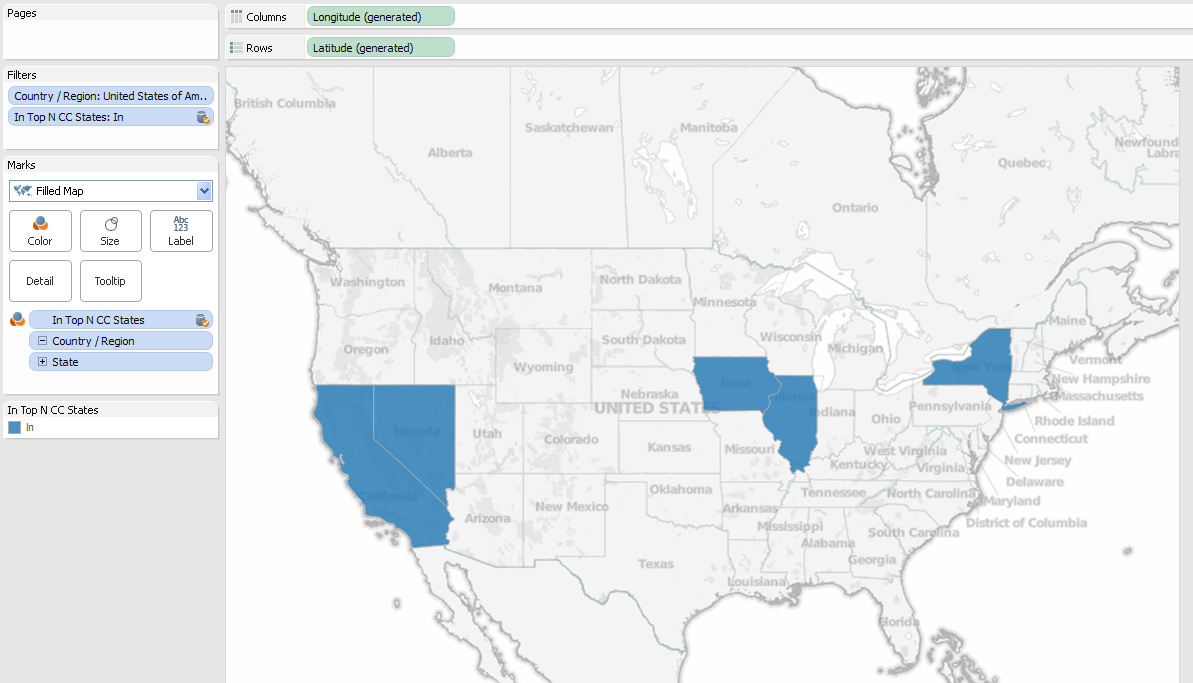
Now you can drag the In Top N CC States calculated dimension from the Coffee Chain data onto the Filters Shelf, and here’s the filter setting:
And the view:
The worksheet is now only returning the 5 states from the primary and secondary data sources that meet the filter criteria from the set from the secondary data source. You’ve now used a Set from a secondary source!
Set from Secondary on Color
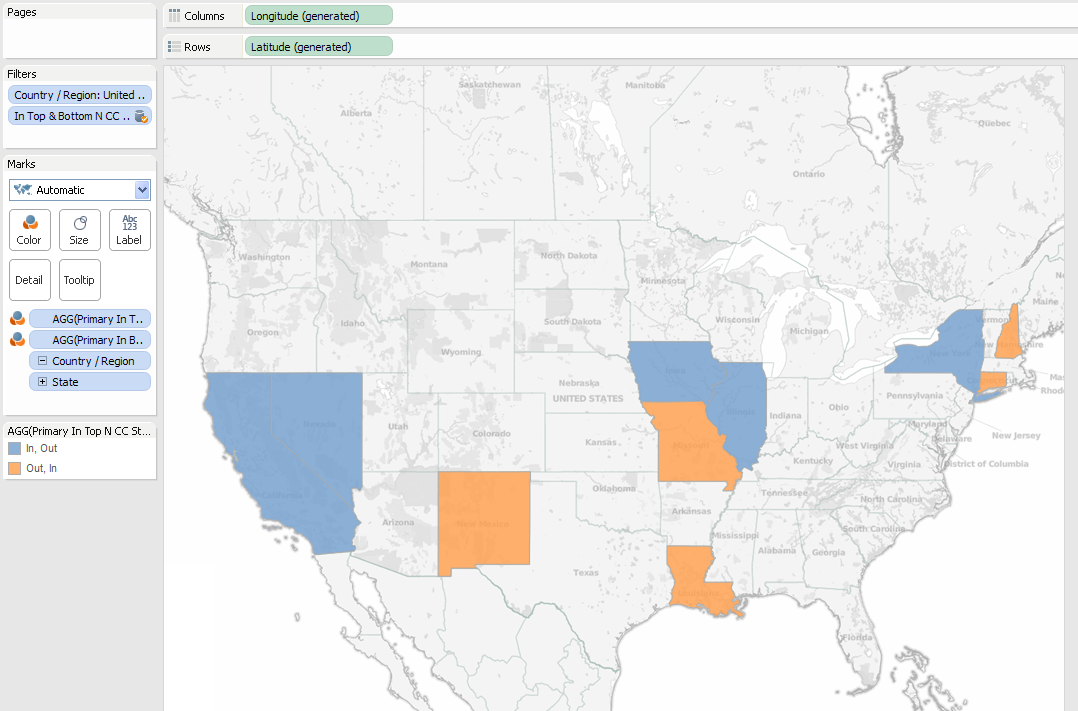
How about using the set calculation in the view? If we change the In Top CC States to All values, and put a copy of the pill on the Color Shelf then we see three different values: In, Out, and Null.
Why are there Nulls? This is one aspect of data blending that can be confusing. In the Superstore Sales data, there are 49 US states (48 contiguous states plus the District of Columbia). In the Coffee Chain data, there are 20 states. 5 of those are In the Top N CC States set (blue above), 15 of those are Out (light orange). That leaves 29 states in the Superstore Sales data have no corresponding rows in Coffee Chain. For the In Top Top N CC States set calculation, rather than assigning those 29 states to In or Out, Tableau assigns a value of Null to those states because they don’t have corresponding values, and in this case they get a dark orange color. This is the same behavior Tableau has for any linked dimension value from the secondary that doesn’t have corresponding values in the primary.
How can we help those Nulls come Out of the closet become part of the Out of the set?
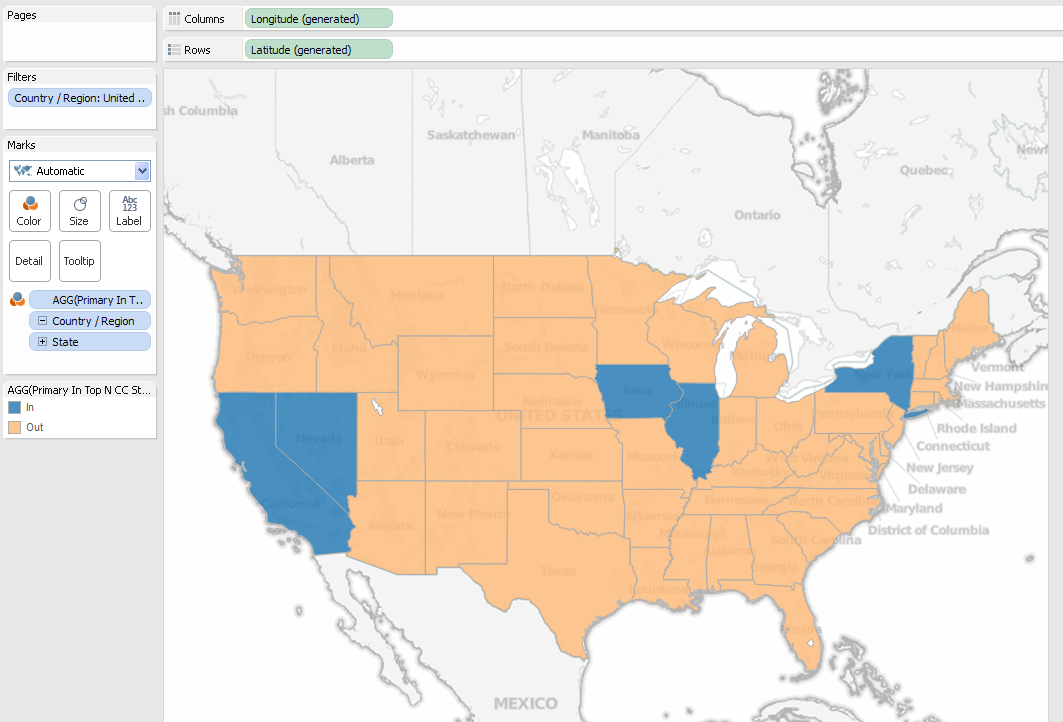
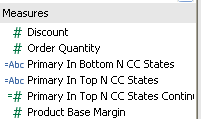
This assignment of Null values is done in the primary data source, as there’s so way we can change it in the secondary (without doing some sort of padding in the secondary for all of those states). However, there is a way we can do that in the primary data source. Tableau does all the computation it can within each data source, then blends the data sources together, at which point things like calculations that refer to another data source are computed. We can create a calculation in the primary that refers to the set in the secondary, and test whether the set calculation is returning Null. Here’s the formula from Superstore Sales for the Primary In Top N CC States calculated field:
IFNULL(MIN(IIF([Sample - Coffee Chain (Access)].[Top N CC States],"In","Out")),"Out")
The inner IIF() is a row-level calculation that evaluates the In/Out of the Set, then that gets wrapped in MIN() because we’re working across the blend – Tableau requires us to aggregate all measures and dimensions used in calculated fields from other data sources. The IFNULL() then tests the result of the MIN(), and if there’s a Null from one of those 29 states that is in the primary but not the secondary, the IFNULL() Outs that one as well. Here’s a view with the calculation, where now everything is In or Out:
But you don’t have to be monogamous limit yourself to just one set. You can use combined sets from the secondary, for example in this view with CoffeeChain as the Primary I’m showing the top and bottom 5 states from the CoffeeChain data:
Now to talk about complications and workarounds before getting into some advanced cases:
Discrete vs. Continuous Measures
It’s important to note that the Primary In Top N CC States set calculation is a measure, because it’s using an aggregate from the secondary data source.
One effect is that Tableau won’t let us filter on discrete (blue) measures like the Primary In Top N CC States:
My understanding is that this has to do with Tableau needing to know the domain (range of values) of measures to build the filter. (Here’s a Tableau Idea to support this, vote it up!) However, we can filter on continuous measures, so if you want to use that primary filter you can change the calc to return numbers instead of strings, like this calc called Primary In Top N CC States Continuous:
IFNULL(MIN(IIF([Sample - Coffee Chain (Access)].[Top N CC States],1,0)),0)
And this will work fine as a filter:
Alternatively, you could use a table calc filter such as LOOKUP([Primary In Top N CC States],0) since discrete measures based on table calculations can be used as filters. I prefer the regular aggregate for performance reasons: Table calculation filters are applied after the data has been returned to Tableau, so that can lead to a lot of unnecessary traffic across the wire.
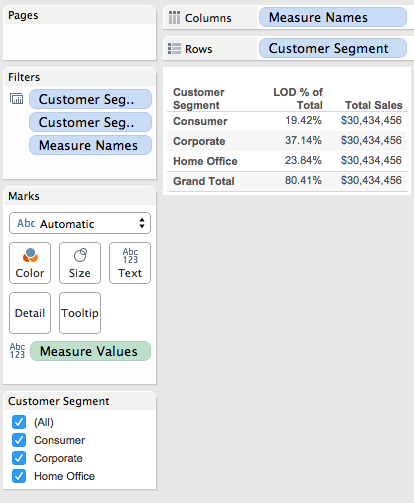
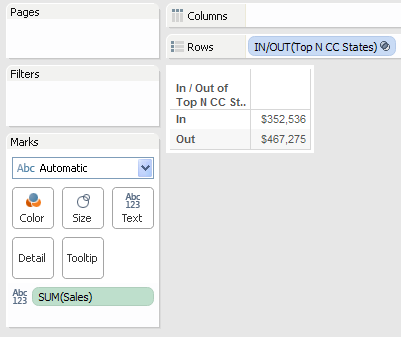
Using In/Out of Secondary Set in Primary Crosstab
In a simple view in Coffee Chain and our Top N set, we can quickly see the Sum of Sales for the In/Out of the set:
We can even set that up from the Superstore as Primary, using the In Top N CC States set calculation from the Coffee Chain secondary, all we need to do is make sure that State is turned on as a blending field and do a little extra filtering to get rid of those pesky Null values:
Advanced Uses for Secondary Sets
You can mix and match Sets from Primary and Secondary sources, here are three examples:
Cohort Analysis
In this view, we’re looking at trends for profits broken down by the performance reviews of our sales people, looking to see if there are any trends. The sales data comes from Superstore Sales, the performance reviews are coming from a secondary data source. The panes are created by the In/Out of the Top 40 Customers by Profit. The top pane shows the sales for the Top 40 customers, the bottom pane everyone else. The lines are colored by the In/Out of the Top 5 Salespeople:
Combining Sets Across Data Sources
To create a combined set, we can use a calculated field that evaluates the sets from the different data sources, like this one that gets the intersection of the Top N States for Sales from both Superstore Sales and Coffee Chain, assuming the Superstore Sales is primary:
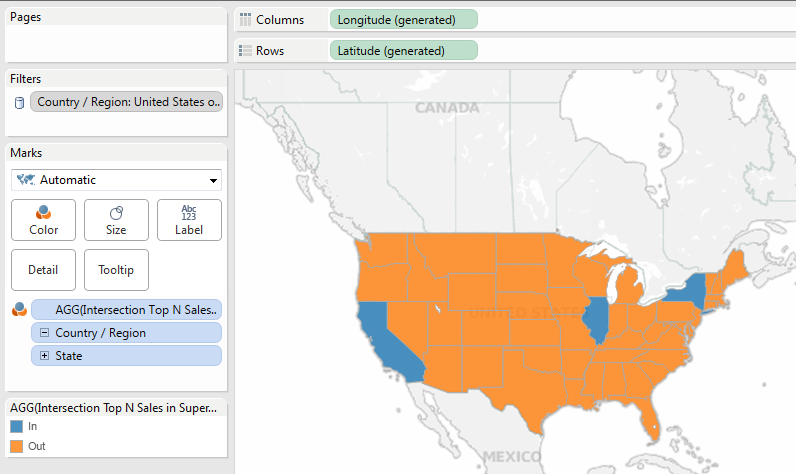
And here it is used in a view, with the Top 5 States from each, only 3 states overlap:
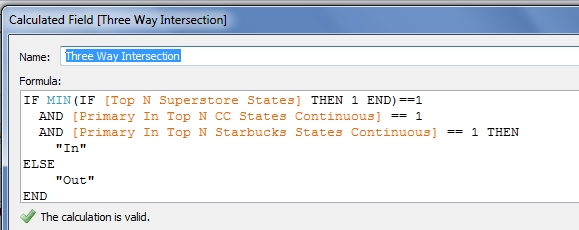
The Three Way
Why stop at only two sets from different data sources? In this view using Coffee Chain as primary, we’re coloring the states based on the In/Out of the Top N States by Coffee Chain Sales, the Top N States with highest # of Starbucks per capita (data from Statemaster.com), and Top N States by Superstore Sales. Three data sources, three sets:
And, of course, you can build calculated fields as well, here’s one in Superstore:
With a little creativity and a whole lot of jokes at the maturity level of the average American teenage boy, we can get more out of data blending and sets. If you’d like Tableau to have more support for secondary sets out of the box (and generally treat secondary data sources more like primary data sources), please vote for http://community.tableausoftware.com/ideas/2773.
Now, go forth and use sets in strange placesany position you want in new ways!


 That is quite a bit easier to describe to new users!


 And then the calc can be placed in the view, filtering for “In”: