This section covers how to generate different types of analyses in Tableau. For example, how to do your own projections and forecasts (a lot of that material comes from Tableau v7 and earlier), some cohort analysis, etc.
Be sure to check out the following sources of material on the Tableau Community:
Projections
Forecasting, Run Rate and Projected Visits:
http://community.tableausoftware.com/thread/116355
projections – iterative over months, messy
http://community.tableausoftware.com/message/178156
file is: Projection Sample jtd edit.twbx
projections – easy linear trend
http://community.tableausoftware.com/thread/117629
file is: Forecast jtd edit.twbx
Another projections thread:
http://community.tableausoftware.com/thread/111437
BYO Optimal Trend Line using table calcs
http://community.tableausoftware.com/message/180906#180906
workbook is Optimal Trend Line.twbx
Duplicate data to do funky action filter where the filtered data still shows difference from current to previous
http://community.tableausoftware.com/message/174252#174252
Comparing dimensions
Also check out Sets, lots of possibilities there.
Comparing different dimensions (surveys, etc.)
http://kb.tableausoftware.com/articles/knowledgebase/calculating-percent-difference-across-dimensions-60
comparing items via table calc across columns:
http://kb.tableausoftware.com/articles/knowledgebase/comparing-items
Each against every other
http://drawingwithnumbers.artisart.org/comparing-each-against-each-other-the-no-sql-cross-product/
Find complementary products- if customer purchased X, see what else the purchased
http://community.tableausoftware.com/message/171706#171706\
Compare one against the rest
http://kb.tableausoftware.com/articles/knowledgebase/comparing-items
http://interworks.co.uk/andy-cotgreave/us-v-the-rest/
Correlation Matrix by Bora Beran
compare given period (quarter, month, year, etc.) to the same period some time ago (year or previous)
http://community.tableausoftware.com/thread/112972
workbook is date_level_over_year_ago_or_prev.twbx
Benford’s Rule
http://community.tableausoftware.com/thread/118570
http://en.wikipedia.org/wiki/Benfords_law
Create monthly calendar
http://vizwiz.blogspot.com/2012/05/creating-interactive-monthly-calendar.html
https://www.interworks.com/blogs/dwyers/2012/05/22/creating-calendar-views-tableau
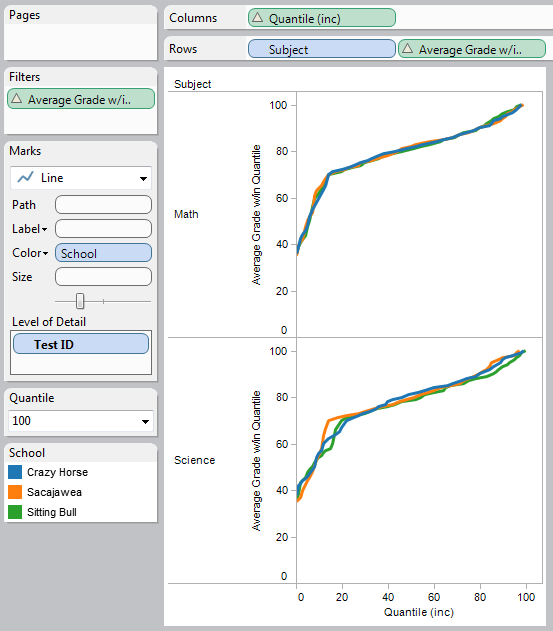
Quantiles
Big post on percentiles with Tableau:
http://www.equinox.co.nz/blog/Lists/Posts/Post.aspx?ID=160
From http://community.tableausoftware.com/thread/113243 by Richard Leeke:
[A] is the measure
[p] is the quantile, e.g. .25 for 25th, etc.
Set compute using to [A], may need to use and advanced compute to order along the desired field.
Return only one value:
// Only calculate for first row of the partition, otherwise return NULL
IF (FIRST()==0) THEN
// p = 0 => minimum, and we are on the first row, so we just want the current value
    IF ([p] == 0) THEN
        ATTR([A])
    // p = 1 => maximum, so lookup the last row
    ELSEIF ([p] == 1) THEN
        LOOKUP(ATTR([A]), LAST())
    // otherwise select the appropriate value
    ELSE
        // The WINDOW_MIN() finds the lowest value at or beyond the required quantile.
        WINDOW_MIN(
            // required quantile is at the mid-point between two values, so take the average
            IF [p] * TOTAL(SUM([Number of Records])) = RUNNING_SUM(SUM([Number of Records])) THEN
                (ATTR([A]) + LOOKUP(ATTR([A]), 1)) / 2
            // row is beyond required quantile
            ELSEIF [p] * TOTAL(SUM([Number of Records])) < RUNNING_SUM(SUM([Number of Records])) THEN
                ATTR([A])
            ELSE
                NULL
            END,
            0,
            IIF(FIRST()==0, LAST(), 0)
        )
END
Return same value for all rows, not including 0th or 100th percentile:
PREVIOUS_VALUE(
    IF (FIRST()==0) THEN
        IF ([p] == 0) THEN
            ATTR([A])
        ELSEIF ([p] == 1) THEN
            LOOKUP(ATTR([A]), LAST())
        ELSE
            WINDOW_MIN(
                IF [p] * TOTAL(SUM([Number of Records])) = RUNNING_SUM(SUM([Number of Records])) THEN
                    (ATTR([A]) + LOOKUP(ATTR([A]), 1)) / 2
                ELSEIF [p] * TOTAL(SUM([Number of Records])) < RUNNING_SUM(SUM([Number of Records])) THEN
                    ATTR([A])
                ELSE
                    NULL
                END,
                0,
                IIF(FIRST()==0, LAST(), 0)
            )
        END
    END
)
Return same value for all rows, including 0th and 100th percentile:
PREVIOUS_VALUE(
    IF (FIRST()==0) THEN
        IF ([p] == 0) THEN
            ATTR([A])
        ELSEIF ([p] == 1) THEN
            LOOKUP(ATTR([A]), LAST())
        ELSE
            WINDOW_MIN(
                IF [p] * TOTAL(SUM([Number of Records])) = RUNNING_SUM(SUM([Number of Records])) THEN
                    (ATTR([A]) + LOOKUP(ATTR([A]), 1)) / 2
                ELSEIF [p] * TOTAL(SUM([Number of Records])) < RUNNING_SUM(SUM([Number of Records])) THEN
                    ATTR([A])
                ELSE
                    NULL
                END,
                0,
                IIF(FIRST()==0, LAST(), 0)
            )
        END
    END
)
Find people who also belong to dimension X
http://community.tableausoftware.com/thread/114620
Concatenating a field from multiple rows into one field using PREVIOUS_VALUE
Richard Leeke version:
http://community.tableausoftware.com/message/180164#180164
Alex Kerin version:
http://community.tableausoftware.com/thread/118259
find difference between dates, counting weekdays, counting work days
http://community.tableausoftware.com/thread/118000
http://community.tableausoftware.com/thread/104481
Also having a separate table that identifies working days/holidays and then joining to that
Dynamic anchor date with a relative date filter
http://voyrapido.tumblr.com/post/22763424744/creating-a-dynamic-anchor-date-with-a-relative-date
Stephen Few’s bandlines in Tableau
http://community.tableausoftware.com/message/198511
For surveys, see Chart Types.
[loop category=”wikicontent” tag=”analyses,forecasting,projection,percentiles,rank,cohort-analysis”]
[field title] – Added [field date]
[content]
[/loop]
Related posts:
- [loop tag=”analyses,forecasting,projection,percentiles,rank,cohort-analysis” exclude=”this” relation=”and” compare=”not” taxonomy=”category” value=”wikicontent”]
- [field title-link][field thumbnail-link]
[/loop]