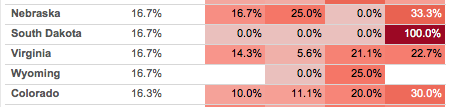
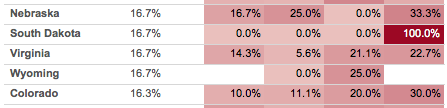
This post is an exploration of why the two views above look different even though the red for 100% is the exact same for each, as in South Dakota for 2013 Q4:
I recently had the opportunity to dive into how Tableau assigns colors, as the goal for this particular worksheet is to make all the 0.0%’s have a white background so the rest of the colors have a little more breathing room. I came out of it impressed with the work that Tableau’s color designers (Maureen Stone and others) have done to create good looking color palettes in Tableau. Read on for some details on how to build your own palettes.
I recently answered a question for a new Tableau user on when to use a Tableau Data Extract (TDE) vs. a live connection, here’s a cleaned-up version of my notes:
Why Use a Tableau Data Extract?
My preference is to first consider using a live connection because extracting data adds another step to the data delivery chain. However there are many situations where that isn’t a workable solution, so Tableau has created Tableau Data Extracts to support situations where a live connection to the source is:
Not possible. Sometimes a Tableau viz can’t have live connection to a production system, for example when you want to share a viz with someone not inside your premises. The extract can be published (whether in a viz or as a published data source) to Tableau Server or Online, or saved in a Tableau packaged workbook (TWBX) or packaged datasource (TDSX), or sent “naked” as a TDE file.
Too slow. There are a number of variations on this:
For example a production system is on a slow network connection so a TDE can be created locally and only have to go over the slow network.
Because data extracts are highly optimized for queries they can be much, much faster than a live connection. I regularly see 100x improvement in load times using Tableau data extracts over MS Access, to the degree that my muscle memory is tuned to making an extract as the first thing I do after connecting to an Access-based source.
Note that older posts (prior to the release of Tableau v8.2) on extracts will talk about them being faster than raw Excel/text connections because at the time the “legacy” aka MS JET engine was used. That is no longer the case with the new Excel/text connector. The new connector takes advantage of Tableau’s data extract (data engine) technology to create a data extract in the background, that’s why the first connection can be slow and then creating an extract can be instantaneous.
The Tableau queries to the live connection might slow down operational queries too much, so having Tableau only query at scheduled extract refresh times is preferable.
Data volumes could be such that millions of records per week of raw data that would be too slow to run live Tableau queries on might be aggregated in a TDE down to dozens or hundreds per week based on some set of categories/dimensions in the data.
Unable to handle the record volumes. MS Excel is limited to 1M records, MS Access tops out anywhere in the 100s of thousands to couple M records depending on the complexity of the table, etc. whereas a TDE can potentially handle billions of records. Another case is situations where the data is stored in multiple tables (potentially across multiple data bases) and a UNION query is used to generate a result that is too big for a live connection but fine for a TDE.
Exposing too much data. There are four cases where extracts can effectively improve security by reducing what data is made available:
We can create extract filters on TDEs so only the necessary records are included.
We can set up the extract to only include fields used in the workbook, in other words we can exclude columns from the extract.
Extracts can be configured to aggregate the data and therefore hide record-level detail.
For file-based sources when we include the files in a TWBX it’s the whole file, so for an Excel file that means that every worksheet in that file is included in the TWBX. If we extract the data then only the necessary data for the workbook is in the TDE.
Unable to handle the data volumes. A related case is that since a TDE is highly compressed it can be a lot smaller than the original uncompressed source. I’ve seen people use TDEs instead of file-based sources to make distribution of packaged workbooks easier.
Not supporting certain calculations. Tableau data extracts have generally supported more functions than any particular data source (with the exception of RAWSQL functions). One example is that in the “old days” before Tableau 8.2 with the new Excel/text connector we were stuck with the MS Jet engine for connecting with Excel & text files and that couldn’t handle COUNTD(), MEDIAN(), In/Out of Sets among other drawbacks, so we’d create an extract. Another example is that currently not all sources support the Level of Detail Expressions introduced in v9.0 and again we can work around that by creating an extract.
Unable to handle the complexity. There are various computations (such as using top and conditional filters, nested calculated fields, etc.) that TDEs can handle in combined ways that some data sources can’t. For example MS Access databases are one of my main data sources and in some Tableau worksheets if I switch from the TDE to the live connection the MS JET engine gives me a “query too complex” error.
Actually a situation where multiple file-based sources needed to be put together…with TDEs it’s possible to add data to an extract from multiple file-based sources, which can be handy when you are integrating data from various producers at different times. Tableau is working on improving this: At the 2015 Tableau Conference they demoed a feature for creating federated queries across multiple data sources (including server-based sources, other TDEs, etc.). From what I saw Tableau will be able to do this in a live connection, however I’m guessing that we’ll often want to be using TDEs for performance reasons.
Other Features of Tableau Data Extracts
A few other advantages of TDEs are:
Materialized expressions. Tableau will “materialize” record-level calculations that use only fields from a single data source and are not dependent on run-time values — i.e. not using TODAY(), NOW(), USERNAME(), ISMEMBEROF(), or a parameter — as fully indexed & compressed fields in an extract. This can improve performance in many cases, for example when splitting name or address fields and/or creating datetime fields out of strings.
Access to cloud-based data sources. In order to make cloud-based sources such as Salesforce.com, Google Analytics, oData, and the Tableau Web Data Connectors useful for the kinds of at-the-speed-of-thought analytics that Tableau enables we have to use Tableau data extracts. Other cloud-based sources such as Amazon Redshift, Google BigQuery, and Microsoft Azure can be used as a live connection or extracted as needed.
Option to publish to Tableau Public. For performance reasons we can only use TDEs when publishing to Tableau Public.
TDE Limitations
However, Tableau Data Extracts do have some limitations and there are cases when they are not suitable or more difficult to work with than a live connection:
TDEs are by definition not a live connection to the source. This means that Tableau Data Extracts are not usable if you’re needing “real-time” data in your Tableau viz. Also if the refresh time of a TDE is more than the desired data refresh time then TDEs aren’t really feasible.
Tableau Data Extracts can’t be created from OLAP sources such as Oracle Essbase or SSAS. They can be created from SAP BW cubes, however.
Changing the data structure of the underlying data can require rebuilding the entire TDE, which may not be very easy, take too much time, become impossible if the file-based source you used for an incremental append is no longer available, etc.
Tableau’s support for incremental loads, slowly changing dimensions, and updates to existing rows is minimal to non-existent.
Tableau Data Extracts do not support RAWSQL functions, nor can we use Custom SQL on an already-created extract. One use case for RAWSQL is when the underlying data source supports a given function and Tableau does not yet support that feature for that source.
TDEs can become too slow to refresh and/or queries on them become too slow based on the data structure, here are some known factors:
So a billion-row extract might be plenty fast and a million-row extract on a complex data structure might be too slow, your best bet is to do your own testing.
As of this writing (January 2016) I haven’t heard of anyone else being licensed to read from TDEs so the only pieces of software that can read from TDEs are Tableau Desktop, Tableau Reader, Tableau Server, Tableau Online, and Tableau Public. There’s no published API for reading TDEs and trying to save large CSVs from a Tableau worksheet is likely to run into out-of-memory problems so if you’re looking for more permanent storage for data so you can get at it later you’re likely to want to look elsewhere.
Refreshing TDEs puts more and more load onto Tableau Server and that can impact delivering visualizations, so doing the work to make the underlying source fast enough to use a live connection may be preferable to the extra hardware & configuration needed to make the TDE refresh fast enough.
TDEs don’t include user-level security, those have to be set up higher up in the stack in the Tableau Server data source and/or Tableau workbooks that use the TDE, which means there’s extra work to prevent unauthorized users from getting access to the data in the Tableau views and the TDE itself. It may be better to implement that security in the raw data source (which I know makes my DBAs happy because they get to retain control).
To eliminate and/or work around the performance limitations of TDEs I see people doing one or more of the following:
Read Designing Efficient Workbooks by Alan Eldridge and implementing the suggestions there, it’s the [insert holy-book-of-your-choice metaphor here] for Tableau performance tuning.
Create multiple data sources on the same underlying data, the basic distinction is using a fast & lightweight TDE for the high-level views and then the detail reached via drill-down (i.e. Filter Actions) is stored in a big, relatively slower TDE or live connection.
Use ETL tools such as Alteryx or Trifacta to pre-compute, pre-aggregate, and transform the data to make it fast in Tableau (and potentially use a TDE).
Do the necessary performance tuning in the existing data source fast enough to use as a live connection.
Deal with high volume/high performance requirements by creating a new data source whether that be a tuned datamart/data warehouse/data lake or using something like Teradata, Vertica, Hadoop, Exasol, etc.
Conclusion
Thanks to Brian Bickell for To Extract or Not to Extract (published 2014-04-29) and Tom Brown for Tableau Extracts (published 2011-01-20), those posts helped validate and round-out bits that I’d missed. Also thanks to Alan Eldridge for Designing Efficient Workbooks, it’s on my “must read” list of Tableau resources. If you have other pros & cons of extracts, please let me know!
Many moons ago I did a first post exploring the non-obvious logic of the most secretive of Tableau table calculation configuration options: At the Level. A few weeks ago I was inspired by a question over email to dive back in, this post explores At the Level for the five rank functions: RANK(), RANK_DENSE(), RANK_MODIFIED(), RANK_UNIQUE(), and RANK_PERCENTILE(). The rank functions add a level of indirection to the already complicated behavior of At the Level and I don’t have any particular use cases, so…
If you are like me and won’t rest until you understand every detail of Tableau’s functionality, then this post is for you. Otherwise you may find this post unhelpful and/or confusing due to extreme table calculation geekery. You have been warned.
The particular challenge with ordinal functions like INDEX(), FIRST(), and the rank functions is that we absolutely have to understand how addressing and partitioning works in Tableau, and then we tack onto that an understanding of how the calculations work, and finally we can add on how At the Level works. For the first part, I suggest you read the Part 1 post on At the Level, it goes into some detail on addressing and partitioning. To understand the rank functions here’s the Tableau manual for table calculations (scroll down to the Rank functions section). Finally, read on for how At the Level works for rank functions.
We’ll talk about Sets in a bit, first we need to do a little forep discuss another one of the new features in Tableau v9.2: Min and Max for Booleans.
This post is the third in a series on new features in Tableau 9.2. It covers unannounced features in a version of Tableau that hasn’t been released yet so the features discussed here may change prior to release, especially if the folks at Tableau get a headache over my Sets puns.
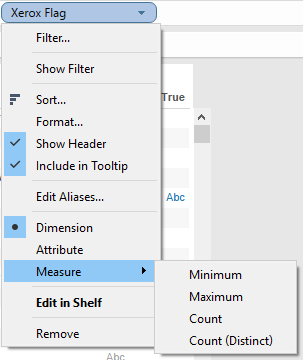
In Tableau v9.1 and earlier we can only aggregate Boolean fields to do a Count or Count (Distinct). Here I’ve created a Xerox Flag calculated Boolean dimension with the formula CONTAINS([Item], 'Xerox') to identify all order items that include Xerox in the name:
Tableau 9.2 adds MIN(), MAX(), and ATTR() as aggregation options that have a number of impacts on what we can do in Tableau. Read on to find out!
New Aggregations for Booleans
Here’s the new context menu for a Boolean dimension in v9.2 using that same Xerox Flag showing Attribute, Minimum, and Maximum have been added:
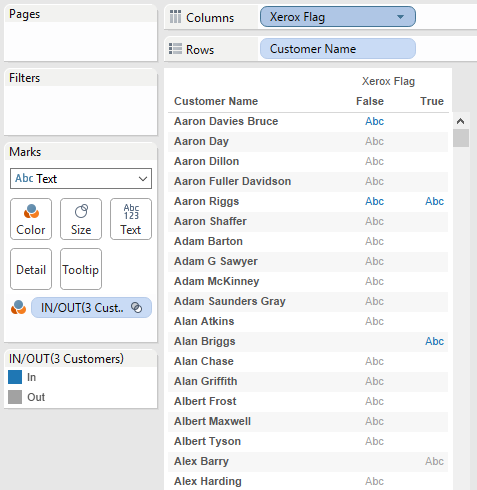
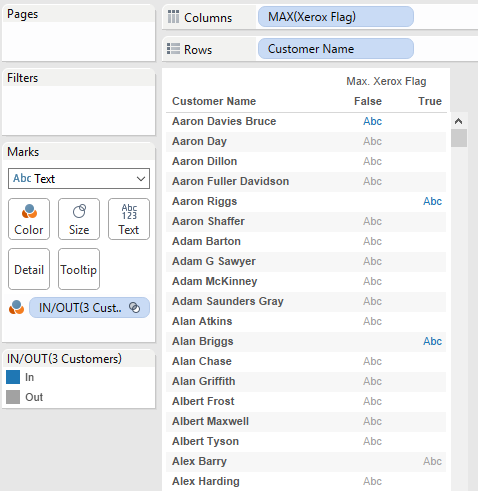
To help show what the new aggregations do let’s start out with this screenshot with Customer Name and Xerox Flag as dimensions, in particular the three rows with blue Abc marks indicating there is data:
Aaron Davies Bruce (Bruce) who only has False as a value for Xerox Flag indicating that he has only purchased non-Xerox item(s).
Aaron Riggs (Riggs) who has both True and False, so he’s purchased both.
Alan Briggs (Briggs) who has only True, so he’s only purchased Xerox item(s).
If I aggregate Xerox Flag as MAX(Xerox Flag) then we see that:
Bruce has False because he has only the one value for Xerox Flag.
Riggs has only True, because the max of True and False is True.
Briggs has True because he has only the one value for Xerox Flag.
If I aggregate Xerox Flag as ATTR(Xerox Flag) then we see:
Bruce has False because he had only the one value for Xerox Flag.
Riggs has * because he has both True and False.
Briggs has True because he had only the one value for Xerox Flag.
What can we do with these new aggregations of booleans? Here are some ideas:
Filter by Discrete Aggregate
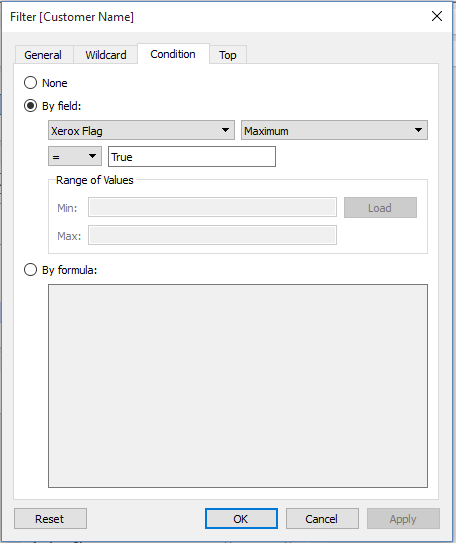
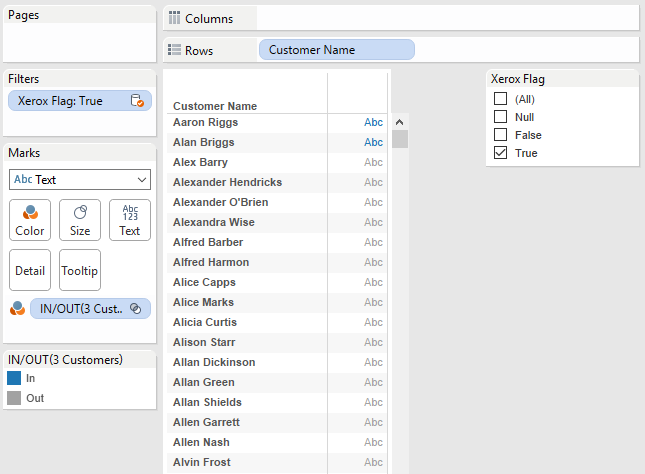
In an earlier Feature Geek post I’d described how in 9.2 we can filter by a discrete aggregate. We can put MAX(Xerox Flag) pill onto the Filters Shelf, filter for True, and boom we’ve got only those customers who have purchased one or more Xerox items–including Riggs and Briggs:
There is still one limitation here, we can’t drop ATTR(Xerox Flag) from a primary data source onto the Filters Shelf:
I suspect the reason why has to do with ATTR() being a special aggregation computed in Tableau whereas MIN(), MAX(), COUNT(), and COUNTD() are all computed in the data source.
However, when using data blending we can put ATTR(secondary dimension) on the Filters Shelf because of how data blending works – many aggregate filters on secondary sources are generally computed in Tableau, not in the data source, so Tableau already has that ability to filter on ATTR(secondary dimension). Here’s an example using Xerox Flag from a duplicated secondary source:
In v9.1 and earlier if we had a Boolean dimension and wanted to use it to create a cohort then we had to do an extra step that was often confusing to new users. For example if we want to only return Customers who have purchased a Xerox item we’d build a Conditional Filter using a By Formula: calculation like SUM(IF [Xerox Flag] THEN 1 ELSE 0 END) >= 1:
The inner IF statement is evaluated for every row and returns 1 or 0, then those results are summed up for each Customer and then if that aggregated result is >= 1 then the Customer is returned:
Having MAX() as an aggregation for a Boolean lets us get rid of the indirection of the SUM(IF… calculation and most of the typing as well since we can now specify the aggregation in the By Field: section of the view. All I had to do for this filter besides mouse clicks was type in “True”:
That is quite a bit easier to describe to new users!
Boolean Dimensions from Secondary Sources in the View
In v9.1 and earlier we couldn’t place Boolean dimensions from secondary sources in the view. Here in v9.1 I’ve duplicated Superstore and I’m trying to use the Xerox Flag from the secondary as a dimension and Tableau isn’t letting me drop it on Columns:
The reason why is that “under the hood” Tableau effectively treats dimensions from secondary sources as ATTR(dimension) — that’s why we get * for dimensions from secondary, see my 2014 Tableau Conference session on Extreme Data Blending for more details. In v9.1 and earlier Tableau does not support ATTR(boolean dimension) so we couldn’t drop the boolean. I already demonstrated above how we can use ATTR(secondary dimension) as a filter, and in v9.2 now we can directly use secondary boolean dimensions in the view, here’s the Xerox Flag boolean:
And we can use that Xerox Flag boolean dimension from the secondary as a filter:
Sets with Your Secondary (9.2 Style)
Awhile back I wrote a post on how to use Sets from secondary data sources. You see, ordinarily we can’t drag in a Set from a secondary data source, they are greyed out:
The workaround I’d come up with was a) to create a calculated dimension in the secondary source based on the Set that b) converted the boolean True/False of the Set into text or numbers that could be used as a dimension filter. For example this formula turns the Top N CC States Set from Coffee Chain into a calculated field of a usable data type:
And then the calc can be placed in the view, filtering for “In”:
Step b) was necessary because Tableau would not let us directly use a dimension with the Boolean data type from the secondary. With Tableau v9.2 we get a little closer to being able to have Sets w/out interruption use Sets more directly. We still need step a) convert the Set into a calculated dimension but we no longer need step b).
Here in v9.2 I’ve taken the Top N CC States Set and created a calculated Top N CC States Dimension field that has the formula [Top N CC States] so it’s just passing the boolean True/False into a calculated dimension:
And in v9.2 I can directly drop this calculated dimension as a filter:
So we can use Sets from secondary sources in v9.2 a little more easily than we could before.
Conclusion
Besides the big new features (Mapbox!!) Tableau continues to make iterative improvements in the ease of use of the software. Being able to aggregate booleans using MIN(), MAX(), and ATTR() just like we can other dimensions takes away the mental friction introduced by having to remember the data type every time we want to aggregate.
Tableau Public is running v9.2 already and you can see the aggregated booleans workbook and download it to your v9.2 beta. (If you’re not running the beta, you can get it by contacting your Tableau sales rep).
What’s New in Tableau 9.2?
Roughly two weeks after the public release of Tableau 9.2 I’ll be doing an online training on all the new features in Tableau 9.2 Desktop – this post is a sample of what you’ll be seeing in the course, a combination of how the feature works, where the edges are and how you might use it. Sign up below to get more info when the course is available!
There are cases where we have bar charts whose centerline is not zero, for example when we’ve indexed a measure to have a base of 100. Here’s an example where the SUM(Sales) for each product Category is indexed to the average sales per Category:
What happens when we want the bars to start at 100 and then go up or down from there, like this?


 That is quite a bit easier to describe to new users!


 And then the calc can be placed in the view, filtering for “In”:


