We’ll talk about Sets in a bit, first we need to do a little forep discuss another one of the new features in Tableau v9.2: Min and Max for Booleans.
In Tableau v9.1 and earlier we can only aggregate Boolean fields to do a Count or Count (Distinct). Here I’ve created a Xerox Flag calculated Boolean dimension with the formula CONTAINS([Item], 'Xerox') to identify all order items that include Xerox in the name:

Tableau 9.2 adds MIN(), MAX(), and ATTR() as aggregation options that have a number of impacts on what we can do in Tableau. Read on to find out!
![]()
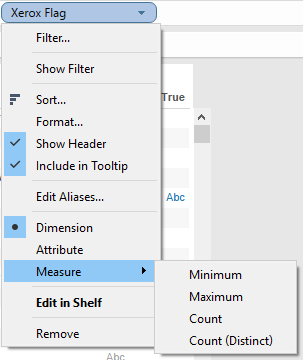
New Aggregations for Booleans
Here’s the new context menu for a Boolean dimension in v9.2 using that same Xerox Flag showing Attribute, Minimum, and Maximum have been added:
To help show what the new aggregations do let’s start out with this screenshot with Customer Name and Xerox Flag as dimensions, in particular the three rows with blue Abc marks indicating there is data:
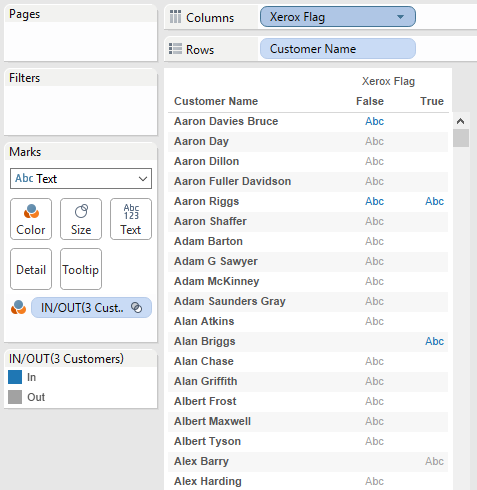
- Aaron Davies Bruce (Bruce) who only has False as a value for Xerox Flag indicating that he has only purchased non-Xerox item(s).
- Aaron Riggs (Riggs) who has both True and False, so he’s purchased both.
- Alan Briggs (Briggs) who has only True, so he’s only purchased Xerox item(s).
If I aggregate Xerox Flag as MAX(Xerox Flag) then we see that:
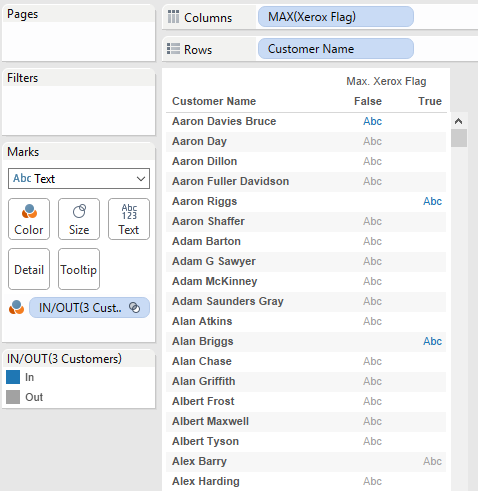
- Bruce has False because he has only the one value for Xerox Flag.
- Riggs has only True, because the max of True and False is True.
- Briggs has True because he has only the one value for Xerox Flag.
If I aggregate Xerox Flag as ATTR(Xerox Flag) then we see:

- Bruce has False because he had only the one value for Xerox Flag.
- Riggs has * because he has both True and False.
- Briggs has True because he had only the one value for Xerox Flag.
What can we do with these new aggregations of booleans? Here are some ideas:
Filter by Discrete Aggregate
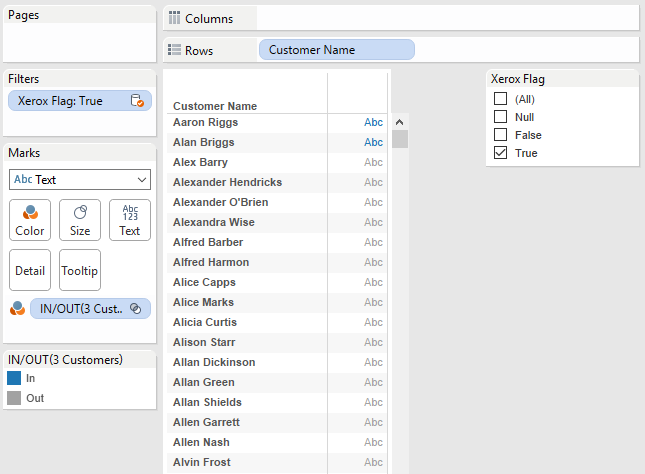
In an earlier Feature Geek post I’d described how in 9.2 we can filter by a discrete aggregate. We can put MAX(Xerox Flag) pill onto the Filters Shelf, filter for True, and boom we’ve got only those customers who have purchased one or more Xerox items–including Riggs and Briggs:

There is still one limitation here, we can’t drop ATTR(Xerox Flag) from a primary data source onto the Filters Shelf:

I suspect the reason why has to do with ATTR() being a special aggregation computed in Tableau whereas MIN(), MAX(), COUNT(), and COUNTD() are all computed in the data source.
However, when using data blending we can put ATTR(secondary dimension) on the Filters Shelf because of how data blending works – many aggregate filters on secondary sources are generally computed in Tableau, not in the data source, so Tableau already has that ability to filter on ATTR(secondary dimension). Here’s an example using Xerox Flag from a duplicated secondary source:

Note that Tableau is adding an extra Null value to the list of filter values because that is Tableau’s default behavior for secondary dimensions used as filters. Vote for Option to eliminate null value form Quick Filter on secondary data source field if you’d like to get rid of this.
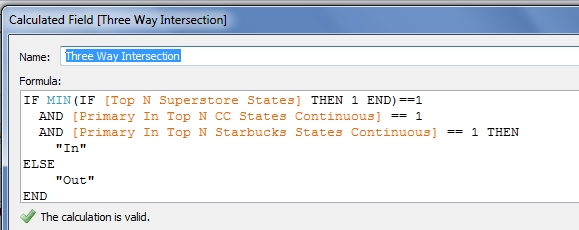
Use in Conditional Filters
In v9.1 and earlier if we had a Boolean dimension and wanted to use it to create a cohort then we had to do an extra step that was often confusing to new users. For example if we want to only return Customers who have purchased a Xerox item we’d build a Conditional Filter using a By Formula: calculation like SUM(IF [Xerox Flag] THEN 1 ELSE 0 END) >= 1:

The inner IF statement is evaluated for every row and returns 1 or 0, then those results are summed up for each Customer and then if that aggregated result is >= 1 then the Customer is returned:

Having MAX() as an aggregation for a Boolean lets us get rid of the indirection of the SUM(IF… calculation and most of the typing as well since we can now specify the aggregation in the By Field: section of the view. All I had to do for this filter besides mouse clicks was type in “True”:
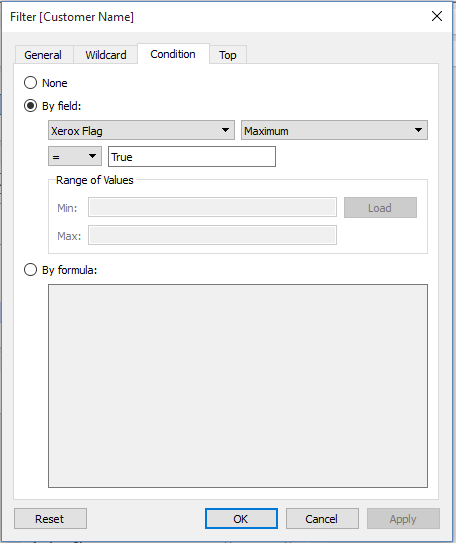 That is quite a bit easier to describe to new users!
Boolean Dimensions from Secondary Sources in the View
In v9.1 and earlier we couldn’t place Boolean dimensions from secondary sources in the view. Here in v9.1 I’ve duplicated Superstore and I’m trying to use the Xerox Flag from the secondary as a dimension and Tableau isn’t letting me drop it on Columns:

The reason why is that “under the hood” Tableau effectively treats dimensions from secondary sources as ATTR(dimension) — that’s why we get * for dimensions from secondary, see my 2014 Tableau Conference session on Extreme Data Blending for more details. In v9.1 and earlier Tableau does not support ATTR(boolean dimension) so we couldn’t drop the boolean. I already demonstrated above how we can use ATTR(secondary dimension) as a filter, and in v9.2 now we can directly use secondary boolean dimensions in the view, here’s the Xerox Flag boolean:

And we can use that Xerox Flag boolean dimension from the secondary as a filter:
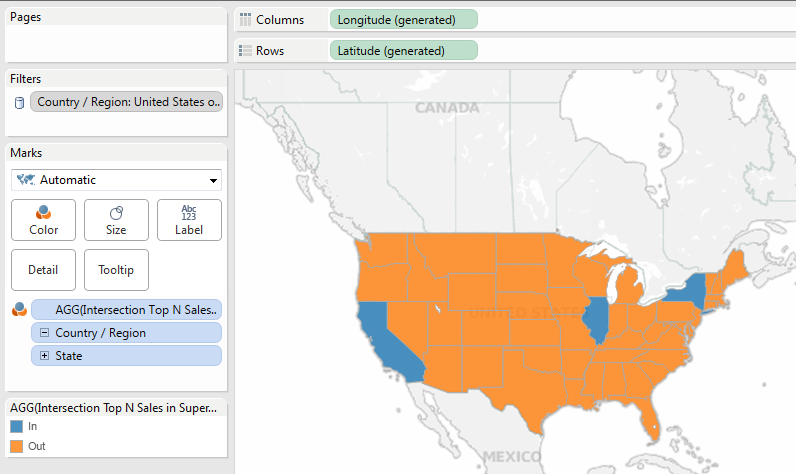
Sets with Your Secondary (9.2 Style)
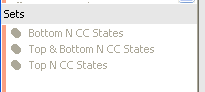
Awhile back I wrote a post on how to use Sets from secondary data sources. You see, ordinarily we can’t drag in a Set from a secondary data source, they are greyed out:

The workaround I’d come up with was a) to create a calculated dimension in the secondary source based on the Set that b) converted the boolean True/False of the Set into text or numbers that could be used as a dimension filter. For example this formula turns the Top N CC States Set from Coffee Chain into a calculated field of a usable data type:
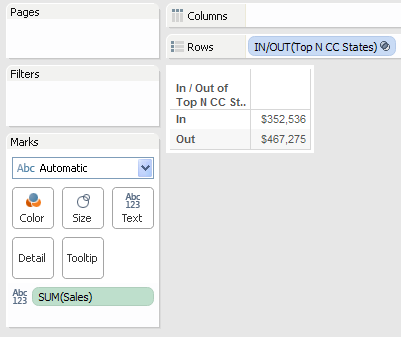
 And then the calc can be placed in the view, filtering for “In”:

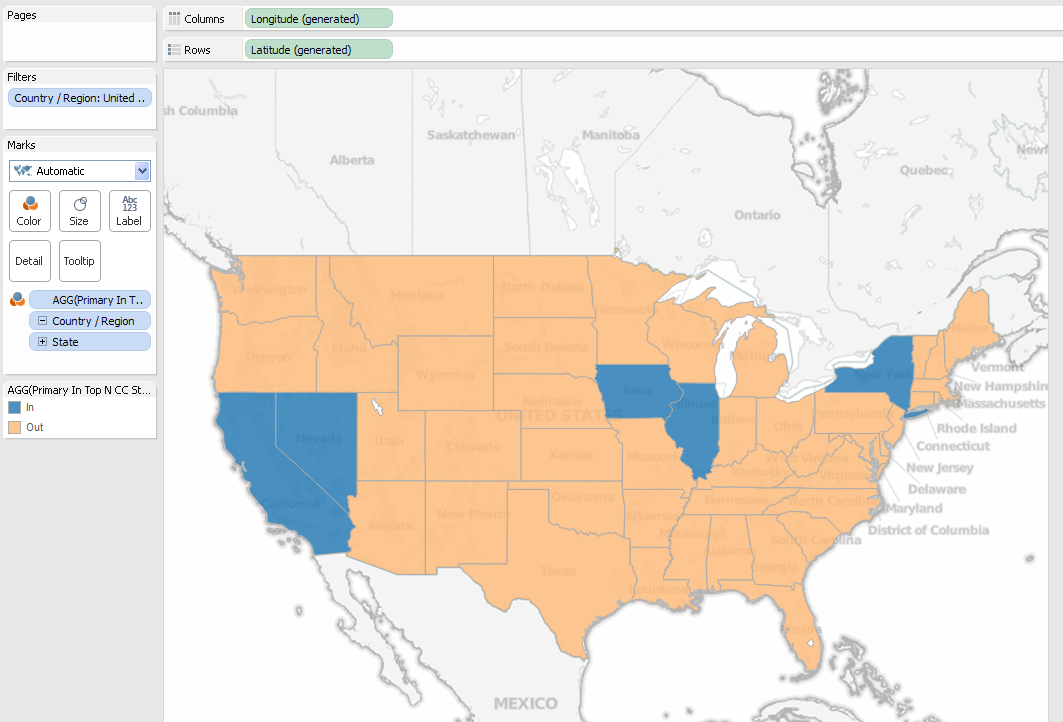
Step b) was necessary because Tableau would not let us directly use a dimension with the Boolean data type from the secondary. With Tableau v9.2 we get a little closer to being able to have Sets w/out interruption use Sets more directly. We still need step a) convert the Set into a calculated dimension but we no longer need step b).
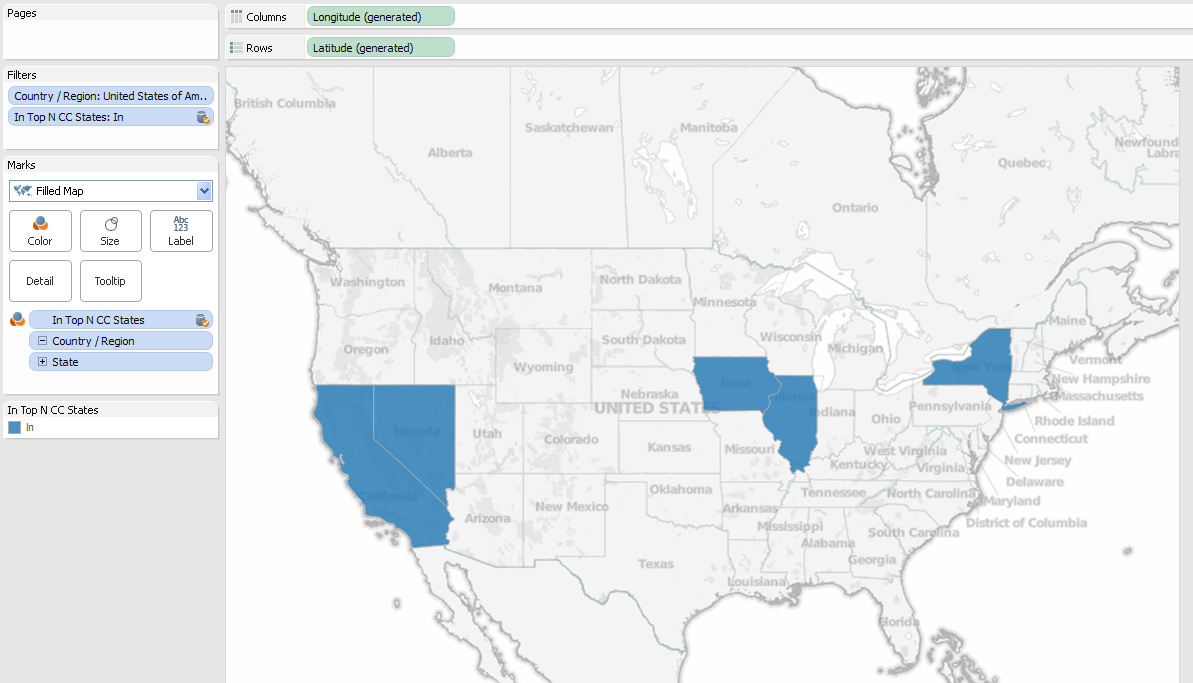
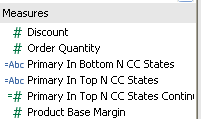
Here in v9.2 I’ve taken the Top N CC States Set and created a calculated Top N CC States Dimension field that has the formula [Top N CC States] so it’s just passing the boolean True/False into a calculated dimension:

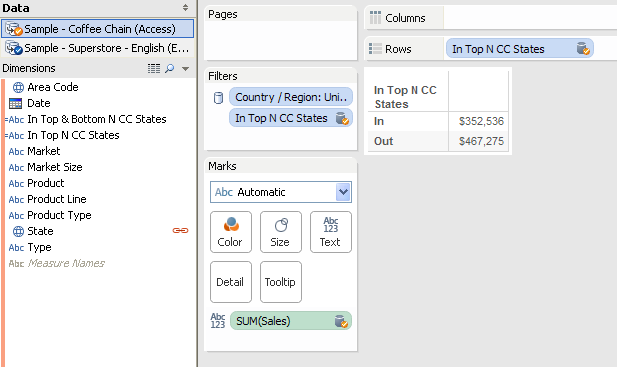
And in v9.2 I can directly drop this calculated dimension as a filter:

So we can use Sets from secondary sources in v9.2 a little more easily than we could before.
Conclusion
Besides the big new features (Mapbox!!) Tableau continues to make iterative improvements in the ease of use of the software. Being able to aggregate booleans using MIN(), MAX(), and ATTR() just like we can other dimensions takes away the mental friction introduced by having to remember the data type every time we want to aggregate.
Tableau Public is running v9.2 already and you can see the aggregated booleans workbook and download it to your v9.2 beta. (If you’re not running the beta, you can get it by contacting your Tableau sales rep).
What’s New in Tableau 9.2?
Roughly two weeks after the public release of Tableau 9.2 I’ll be doing an online training on all the new features in Tableau 9.2 Desktop – this post is a sample of what you’ll be seeing in the course, a combination of how the feature works, where the edges are and how you might use it. Sign up below to get more info when the course is available!
Let me know about the Tableau 9.2 New Features training with Jonathan Drummey and DataBlick