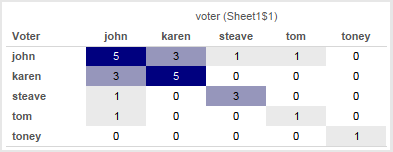
This is another post inspired by a Tableau forums thread. Given a set of survey data that is in a “tall” format with a record for each voter & item (survey question) with their vote the goal is to end up with the sum of matching votes for each pair of voters. So if John & Karen both voted ‘yes’ on the same question that would count as 1 for that question, and then all other matching votes for the questions that John & Karen answered would be totaled up and that number put in a cell for the combination of John & Karen, like so:

The easiest way to do this would be using a join; however the data is from an OData source and those don’t support joins. Also data from OData sources has to be extracted and Tableau doesn’t currently support joining across extracts. The original poster indicated that doing any ETL wasn’t possible, the desire is to have everything just work in Tableau. So we turn to some alternatives, read on for how to build this with and without joins.
Approach
The way I approach this kind of problem is first to understand the goal and understand the data. The data seems pretty clear, and the goal is to end up with a matrix defined by the voter on Rows & Columns. So however many records there are in the data we want to see N^2 values where N is the number of voters. Given that the data source is OData (so no custom SQL) my first thought was to use the No-SQL Cross Product via Tableau’s data densification. That would requiring densifying both the voters (to make the matrix) and the items (to do the comparisons for each voter/item) and my initial attempts got way too complicated way too quickly so I bailed out on that. I came up with a slightly modified solution involving Tableau data blends, however I’m going to go through this first using a join-based solution because it’s easier to describe some of the subtleties involved (plus that will work for many data sources) and then the second time around with the blend-based solution
Join Solution
In this solution I set up the data so it has everything we need – all the combinations of votes and voters – then all we need to do is count records. Since we want to set up pairs of voters for each item, I set up a self-join on item:

This gets us the 47 combinations of voters & votes in the data. Now we can set up a view with the Voter dimensions from the original and the join:

Note that there are some empty cells here: the pairs Tom & Steave and Tom & Toney didn’t vote on any of the same items at all. We’ll come back to this later.
We only want to count voters that had the same vote, so the following Pairwise Vote Filter calc will return only those votes:
[Vote] = [vote (Sheet1$1)]
With that on the Filters shelf, we can set up a view using SUM(Number of Records):

There’s a bunch of empty cells here, what if we want 0’s to show? We can use Format->Pane Tab->Special Values->Text, but that will only work where there is data and we know there are some cells that don’t have data. To get those cells to be marks we can take advantage of Tableau’s domain completion by having a table calculation address on one of the voter dimensions.
We can use a simple table calculation like INDEX() (the field is called Domain Completion Trigger) and the default Compute Using of Table (Across) will address on the voter (Sheet1$1) dimension, padding out the marks:

With that in place we can now build the final view for the join. I set Format->Pane tab->Special Values->Text to be 0, changed the Mark Type to Square, edited the color to use a custom diverging palette (starting at 0), and turned off “Allow labels to overlap other marks” to have Tableau auto-swap the text color so the darker cells have white text:

So the data didn’t have quite all the granularity that we needed for display and we had to turn on data densification with a table calculation to pad it out. In the next section we’ll use Tableau’s ability to do even more padding.
Blend Solution
This uses a different approach. In this case, we set up the view so it has all the marks that we need (but not quite all the marks we’d want), blend in the data for the each half of a pair of voters and then use calculated fields to compute across the data and “paint” the right values into the marks. It uses the original data as a primary source and then the domain completion technique outlined in the No-SQL Cross Product post to effectively get the necessary marks, then uses two self-data blends to get the comparison data that take advantage of the fact that Tableau data blends are computed after densification. For more information on that, see the Extreme Data Blending session from the 2014 Tableau Conference. https://tc14.tableau.com/schedule/content/1045.
Starting out I duplicated the Voter twice, naming one Voter (Rows) and Voter (Cols), then put those on Rows and Columns, respectively. We only see the 5 marks for the 5 voters:

Then we can use the same INDEX() calc to trigger domain completion:

We need to do the comparison at the level of voter *and* item, and for Tableau to compare across data sources the comparisons have to be done as aggregates, so that means that item has to be in the view. When we add Item to the view what we’re seeing in each cell is a mark for each time the the voter on Rows and Voter on Columns both had votes for the same Item. There are 47 marks here, just like the 47 rows we got from the self-join solution.
A problem here is that we lose some of the domain completion, we’ll work around that. (Where I’d tried to start was to do the second set of densification necessary domain complete on Item as well, but that got too complicated.)

Now we can set up a couple of self-blends by first duplicating the data source twice. It’s also possible to duplicate the data connection only (for example by directly connecting to the extract), however that requires more effort to set up. I named the duplicated sources Rows and Cols, and in each created calcs for Voter (Rows) and Voter (Cols), respectively. Then I could add in the Vote fields from each source and Tableau automatically blends the Rows source on Item, Voter (Rows) and blends the Cols source on Item, Voter (Cols). If I hadn’t named the fields the same then I could have used Data->Edit Relationships… Here’s a view showing for each voter pair the vote (Item), the votes from Rows, and votes from the Cols source:

This view lets us see what votes line up with what. So in row karen/column john, we can see that they both voted for items 21, 25, and 32, and had the same votes for each.
The next step is to build a test calculation for the view. Here’s the formula for Pairwise Similar Vote Test:
IF ATTR([blend Sheet1 (test_voting) (rows)].[Vote])
 == ATTR([blend Sheet1 (test_voting) (cols)].[Vote]) THEN 1 ELSE 0 END
We’re using ATTR() as an aggregation because a) that’s the default and b) we are comparing fields from two different sources and Tableau requires them to have some sort of aggregation applied.
In the view, we can see that the calculation is working accurately:

The Vote dimensions from the secondary are useful for checking the calcs, but they aren’t needed at this point so we can get rid of them:

Now to count up the votes in each cell. Here’s the Pairwise Similar Votes w/0 table calculation:
IF FIRST()==0 THEN
    WINDOW_SUM(IF ATTR([blend Sheet1 (test_voting) (rows)].[Vote])
      == ATTR([blend Sheet1 (test_voting) (cols)].[Vote]) THEN 1 ELSE 0 END)
END
This has a Compute Using on the Item so it partitions on Voter (Cols) and Voter (Rows). The inner IF statement is our same calc, those results get summed across all Items in each partition, and then the IF FIRST()==0 returns only a single non-Null value in each cell. Here it is:

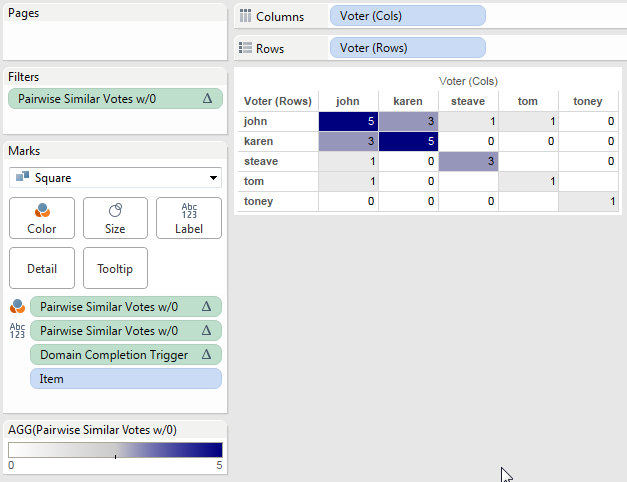
We can then duplicate that view, make the marks Square, duplicate the Pairwise Similar Votes pill to the Color Shelf, set up a custom diverging color, duplicate the pill again to the Filters shelf to set it to filter for non-Null values, and we end up with this:

There are those empty holes where there are no Items for Tom & Steave and Tom & Toney. There’s no way that I know of using this particular blend to fill them in, because Item has to be a dimension in the view the domain completion is limited. This might be useful in some cases, I also came up with an alternative.
In this alternative instead of returning 0 when there are no pairwise similar votes the calc returns Null, here’s the revised Pairwise Similar Votes formula:
IF FIRST()==0 THEN
    WINDOW_SUM(IF ATTR([blend Sheet1 (test_voting) (rows)].[Vote])
      == ATTR([blend Sheet1 (test_voting) (cols)].[Vote]) THEN 1 END)
END
This has the same settings as the first, only now it won’t show any numbers. Then using the same process as before along with tweaking the color palette to start at 0 we can have a view that only shows where there are non-zero results, with white for everything else:

Conclusion
So there’s a couple of ways to go at this, the relatively easy way with a join and the more complicated way with the data blend. Personally, I’m in favor of voting up the Join Data from Different Sources feature request to allow joins across data sources, then even something like an OData source could be extracted twice and joined to create the desired view.
And the Tableau Public link: Pairwise Similar Votes.