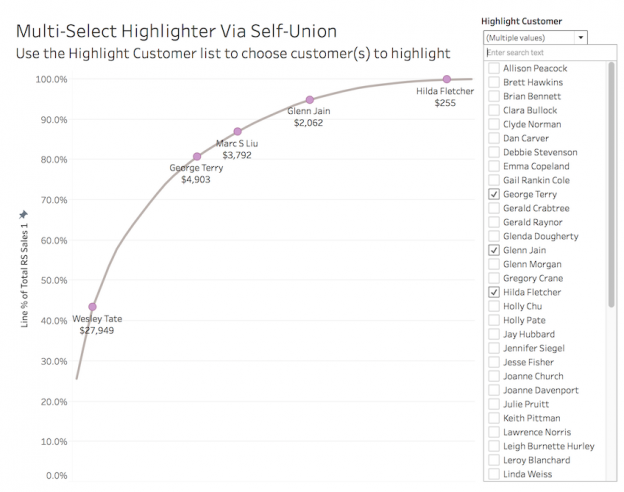
Last year in version 10.0 Tableau introduced the highlighter that lets us quickly highlight marks. It’s got two potential limitations, though:
- We can only highlight a single value or all marks meeting a search criteria, not multi-select values.
- Tableau’s Highlighter (and Highlight Actions) are hard-coded so we don’t have control over the formatting of the highlighted marks.
We can work around those limits in a few different ways:
- Using a separate worksheet with Highlight Action(s) enabled with Hover or Select.
- Using a separate worksheet with Highlight Action(s) enabled, a dual axis, and a duplicated dimension to display different marks. This technique was developed by Rody Zakovich in his post Only Color Marks on Dashboard Highlight .
- Using a self-union’ed data source and a dual axis to get total control over how the highlighted marks are displayed and have more control over the user interface for choosing the highlighted marks. I think I might have invented this technique, I haven’t seen anything quite like it before. This method lets us build views like this:

Read on for how to build these out and choose the right method for you!
