Sorting a Dimension by Two Values At Once

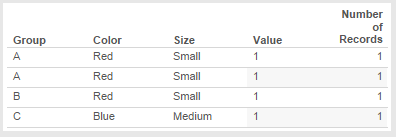
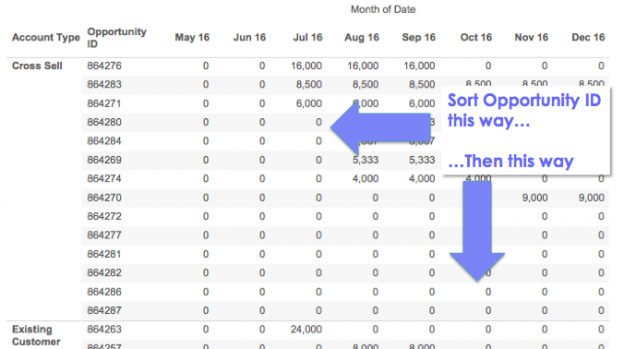
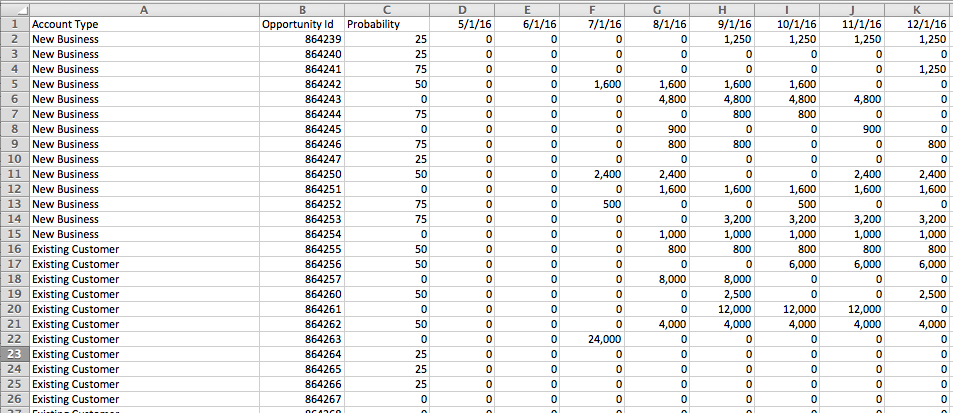
I recently got a question via email about how to sort a view by two different criteria at the same time. Here’s an Excel table of opportunities where for each month and Opportunity ID there’s a forecast of size of opportunity:

Screen Shot 2016-06-30 at 2.12.45 PM

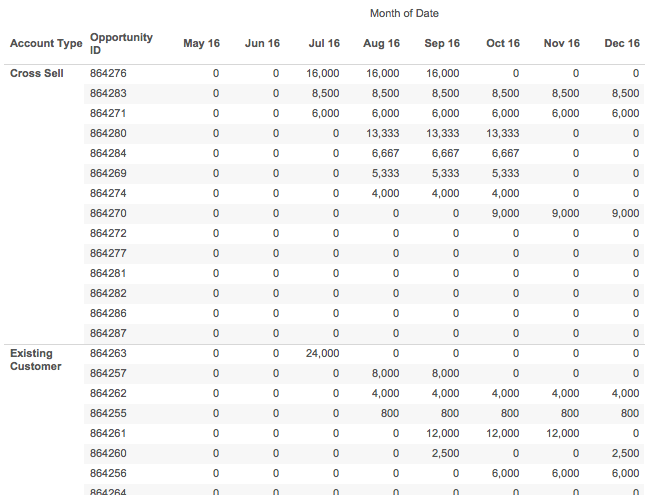
The goal here is to sort the opportunities within each account type by the nearest (by month) and biggest opportunities (by Forecast size) first, so it looks more like this in Tableau:

Screen Shot 2016-06-30 at 2.13.38 PM

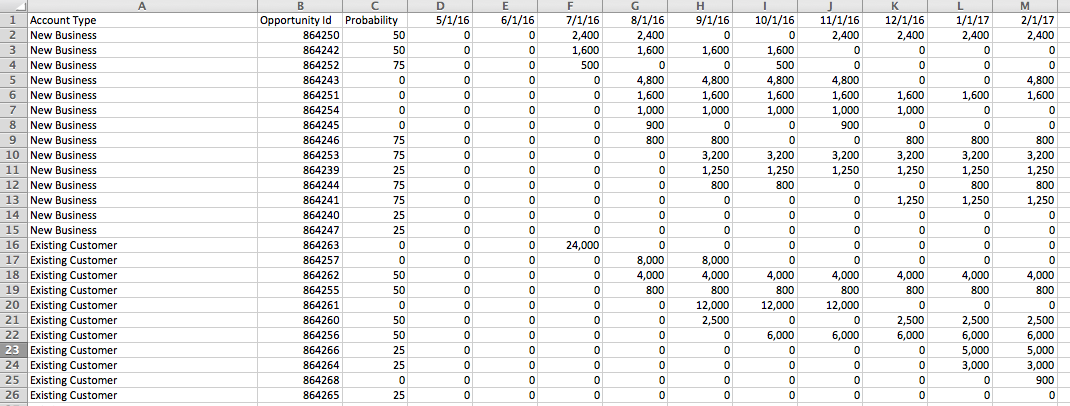
Now with that data in Excel arranged in a tabular form I can sort on December, then November, then October, and so on, and get the desired sort:

Screen Shot 2016-06-30 at 2.14.29 PM

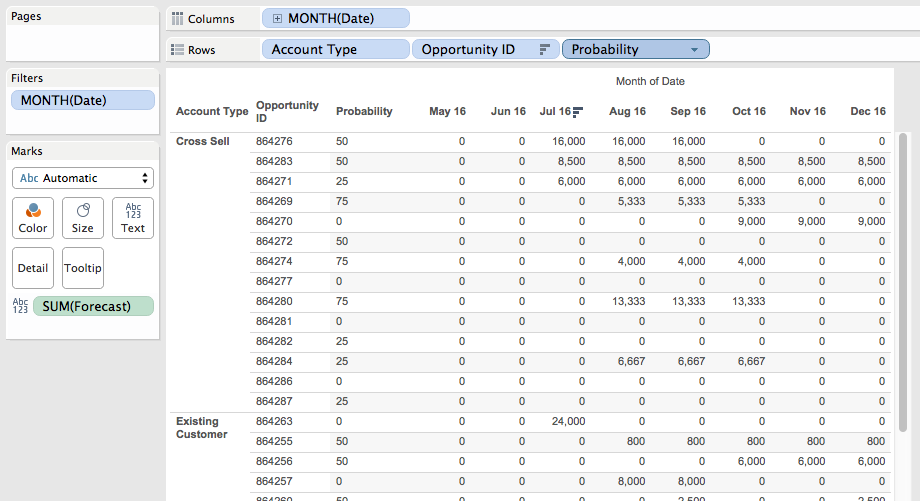
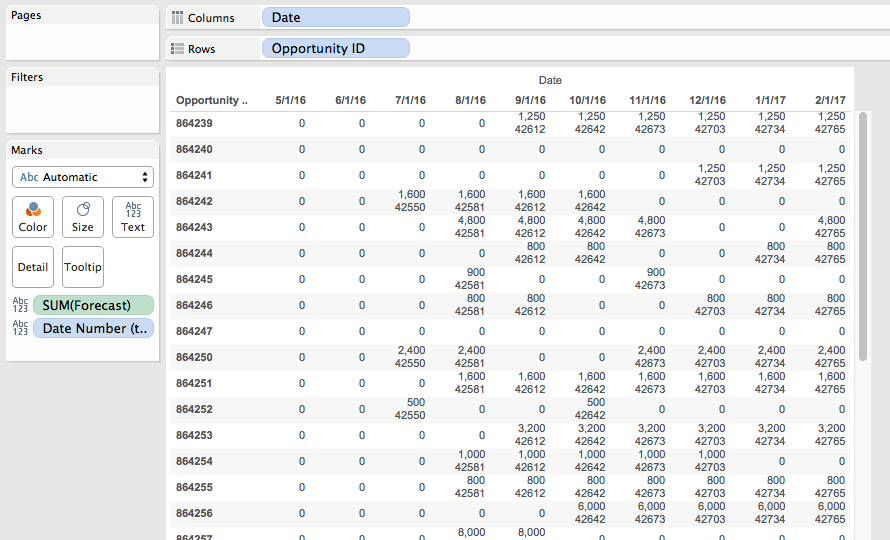
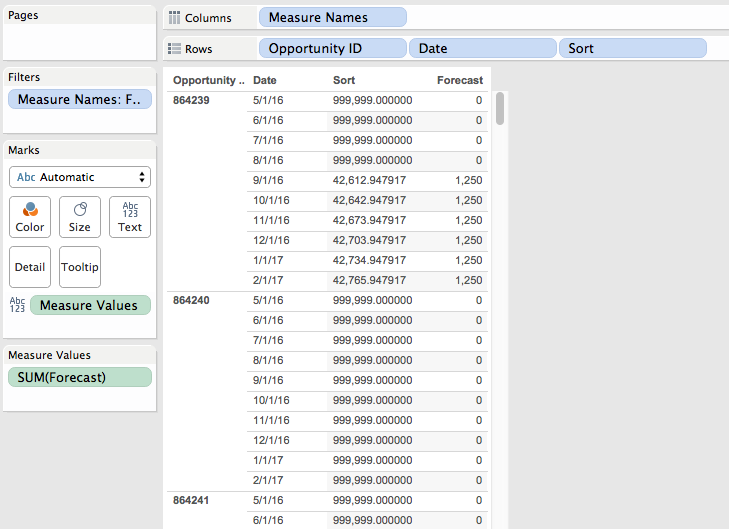
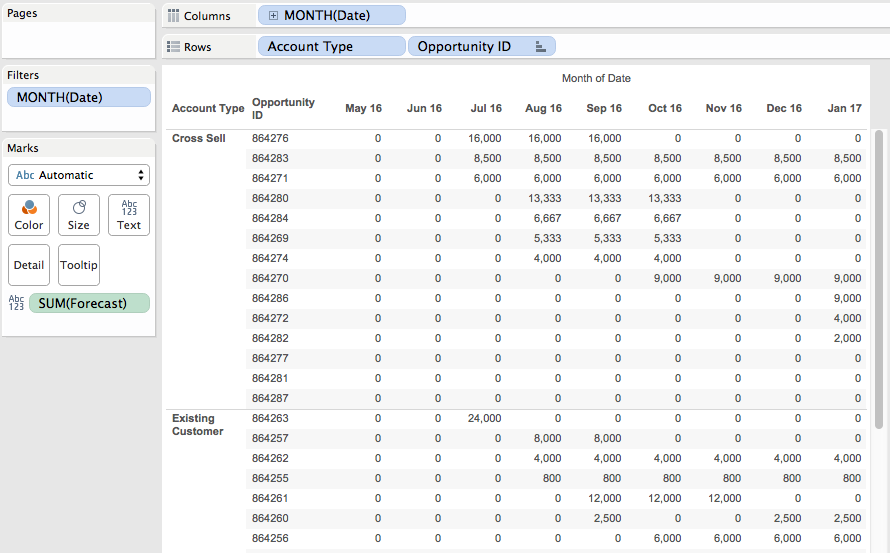
But in Tableau I can’t do that, if I try to work with the data in that “wide” format with a column for each month it just won’t work. If I use Tableau’s pivot feature to make the data “tall” with a record for each Opportunity ID and Month then I still run into problems. I want to sort the opportunities by each month and by Forecast but when I try to sort the Opportunity ID dimension I can’t get it to work, it only sorts by a single month’s values, so in the view below Opportunity ID 864280 should be the first new one for August since:

Screen Shot 2016-06-30 at 2.15.31 PM

The Excel way isn’t good because each month I have to manually re-sort the data. And in Tableau it just seems impossible to get the right sort because it looks like we need to sort in two different directions at once (get the earliest non-zero month for each opportunity, and then sort up and down the opportunities in each account type), and Tableau only lets us sort on one thing at a time. However, it is possible – read on for how to get this kind of sort in Tableau and maybe learn a few math tricks!

Part of how this kind of problem can be more challenging is the way the problem (and data) is initially presented to us. When we see the data in the crosstab form in Tableau the *appearance* is that we need to sort in two different directions. In fact, we really only need to sort in one direction based on the forecast value in the first month for each opportunity, so in the view below we’d want Opportunity ID 864271 to be the first one sorted because it’s from July 2016.

Screen Shot 2016-06-30 at 2.16.45 PM

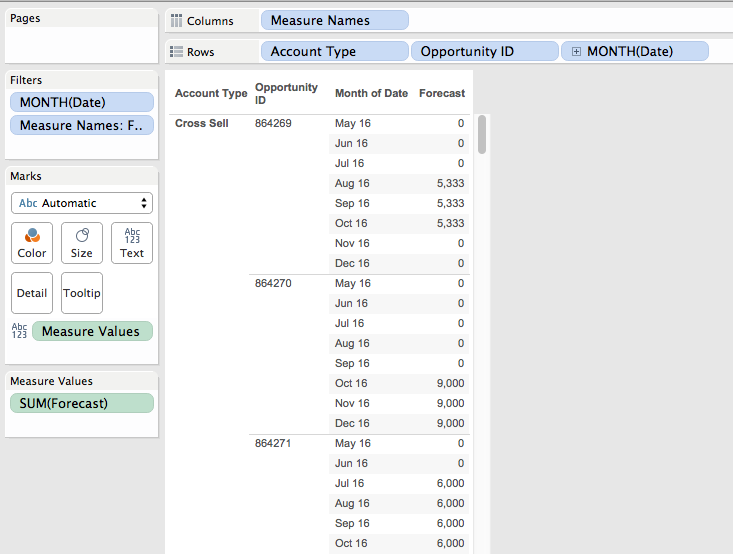
Each opportunity row in the view needs to be sorted within the account type by the first (earliest) month where there is a non-zero forecast and then by the value of Forecast in descending order for that month.

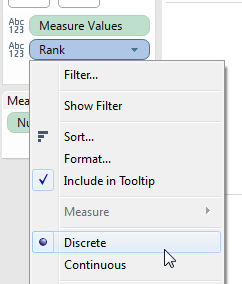
The key to sorting headers and panes in Tableau is that it’s done using the discrete (blue) pills on Rows or Columns from left to right. So the left-most discrete (blue) pill headers are sorted, then the 2nd discrete pill’s headers are sorted, and so on. For discrete dimensions from a primary source we can sort by a measure, use the default alphanumeric sort, or a manually, otherwise any discrete pills are by default alphanumerically sorted or manually sorted.

Therefore in this case I knew I needed to either return a measure that could sort some dimension (like the Opportunity ID) or return a discrete dimension value that with the default alphanumerical sort would work right. Note that filtering wouldn’t work here because the goal is to show a sorted crosstab.

The next part of working out the solution is how to structure this value for sorting. I’ve done some multi-level sorting in the past where I needed a nested sort of single dimension by two different criteria, and a common construct is a number of the form X.Y where the integer portion X is from one criteria and the decimal portion N is from the other criteria. So with the default alphanumerical sort 1.2 comes before 1.3 comes before 2.1 etc.

So for the integer part of the sort I need to convert the date for each opportunity into a number where the Forecast is greater than 0. The Date Number (temp) calc has the formula:

IF [Forecast] > 0 THEN
    INT([Date])
END

Screen Shot 2016-06-30 at 2.17.34 PM

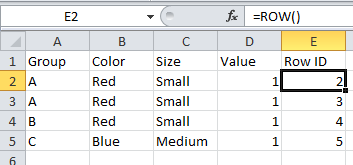
This convers the date into an integer, in this case the number of days since 1/1/1900. To get the first (earliest) month for each opportunity then all I need to do is aggregate it with MIN() at the level of Opportunity ID:

Screen Shot 2016-06-30 at 2.18.01 PM

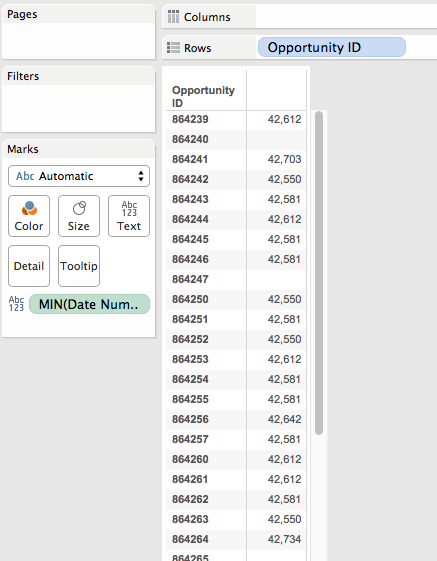
Ultimately, this is is what we’re going to do to get that pill sort of Opportunity ID’s in the final view.

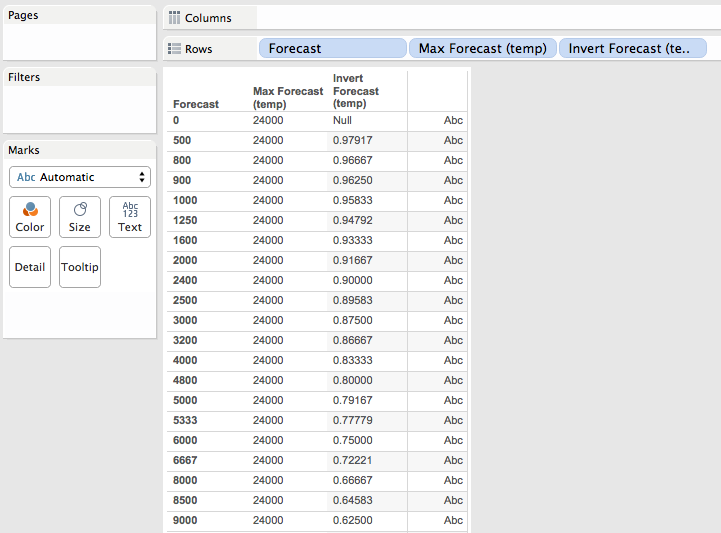
For the decimal part of the sort I needed a number where the smallest numbers reflected the largest values, and it needed a value between 0 and 0.999999 (it can’t be a whole value of 1 because that would affect the integer sort). A way to turn a set of positive numbers into decimal numbers between 0 and 1 is to do X/(max X). In this case X is the Forecast, so to get the max X in the data I used the Level of Detail Expression, here’s the Max Forecast (temp) formula:

{FIXED : MAX([Forecast])}

Screen Shot 2016-06-30 at 2.18.35 PM

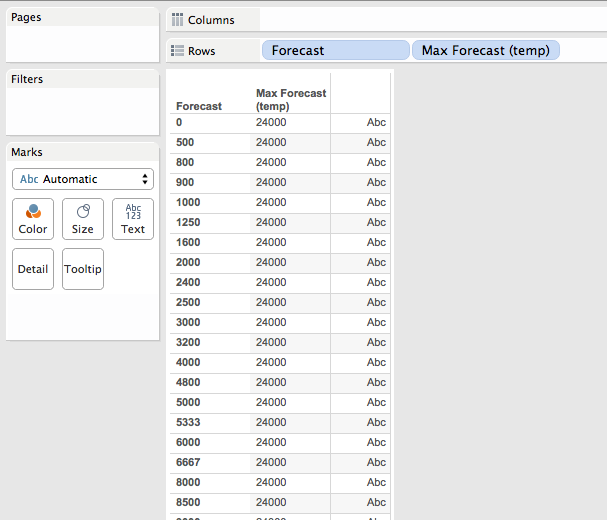
Now if I do [Forecast]/MAX([Forecast]) that’s going to return a number between 0 and 1 that preserves the original ordering of values, i.e. bigger values of Forecast are closer to 1. So to invert that I used use 1 – X/(max X). So if (max X) is 10 and X is 9, then the result of (1 – 9/10) is 0.1, while if X is 2 then the result of (1- 2/10) is 0.8, a bigger number.

We avoid results of 1 that could affect the sort by skipping values of where the Forecast is 0, here’s the Invert Forecast (temp) formula:

IF [Forecast] > 0 THEN
    1-[Forecast]/[LOD Max Forecast Value]
END

Screen Shot 2016-06-30 at 2.19.19 PM

I could have avoided the LOD expression for the max value by just setting a gigantically huge number, however past experience with foreign currencies has shown me that whatever huge number I can imagine is likely to be smaller than reality so I chose to make sure that the value is coming from the data

With all the values worked out I could now put everything together into a single calculation, this is the Sort calc that returns record-level values:

IF [Forecast] > 0 THEN
    INT([Date])
    + (1-[Forecast]/{FIXED : MAX([Forecast])})
//Forecast is 0, return a really big number that will be put at the end of the sort
ELSE
    999999
END

Screen Shot 2016-06-30 at 2.20.09 PM

This calc returns the numbers as record level values.

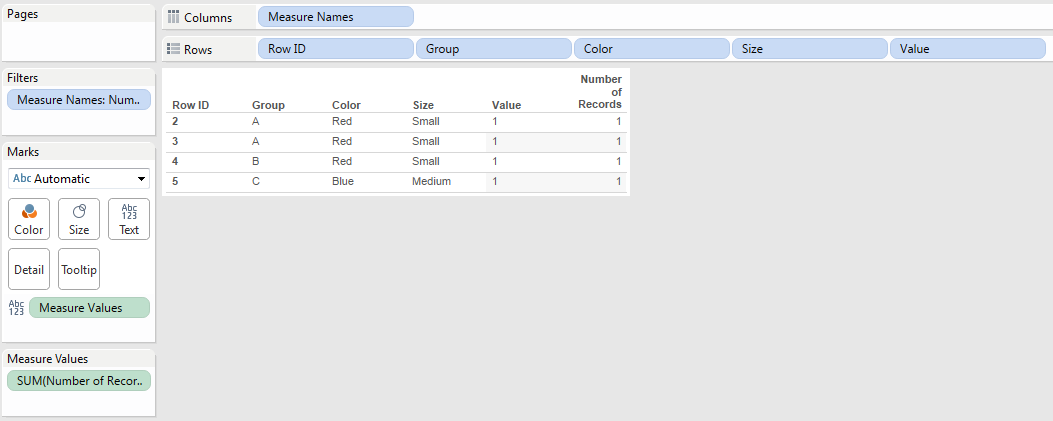
To show how the sort works out I set up this view where the Sort calc is used as the leftmost discrete dimension to show what gets sorted first, with the bar chart we can quickly visually verify that the dates are sorted with earliest months first and then by the Forecast within each month:

Screen Shot 2016-06-30 at 2.20.41 PM

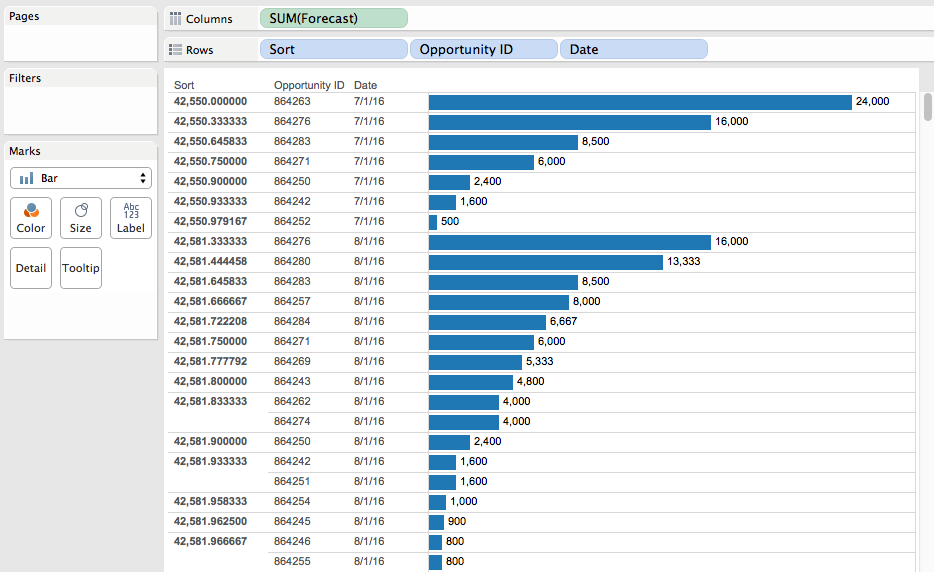
Note that there’s a different value for each Opportunity ID/month combination, when what we really want is that single minimum value for each Opportunity ID/month. So we need to aggregate the Sort measure with MIN() at the level of detail of Opportunity ID, and we can do just that using a pill sort on the Opportunity ID dimension:

Screen Shot 2016-06-30 at 2.21.14 PM

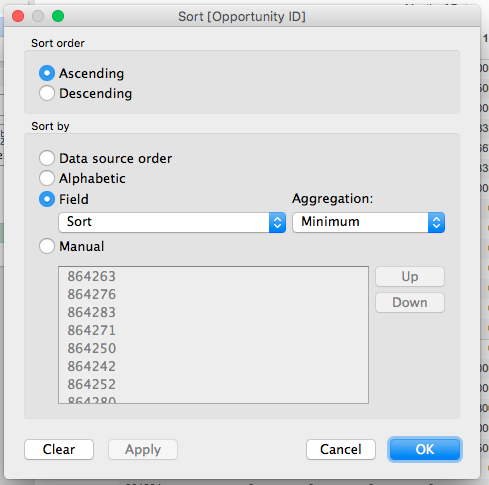
Now we can arrange pills to build the original crosstab view and have the desired sort:

Screen Shot 2016-06-30 at 2.13.38 PM

And as the data updates the sort will automatically work, in this case I’ve added January 2017 to the data:

Screen Shot 2016-06-30 at 2.22.37 PM

Conclusion

The following bits of Tableau knowledge were necessary to get the desired results:

  • How Tableau sorts views using discrete pills.
  • How Tableau’s pill sorts work.
  • A tiny bit of Level of Detail Expression building.

And then the following math tricks were used:

  • Combining two different numbers into one using an integer number for one value and a decimal number for the second value.
  • Making positive numbers into a range of 0-1 using X/(max X). A different formula would be needed if there were negative numbers and/or the desired range was different.
  • Inverting ranges to make big numbers small and small numbers big using 1 – X/(max X)

FYI if LOD expressions are not available in your particular data source then you could use a table calculation, a data blend, or just manually enter your equivalent of the Max Forecast value. I set up a table calculation version as well in the Sorting by Two Values Tableau Public workbook.

Show Me *All* The Numbers: Displaying Every Record for Too Tall Data

Here’s a sample data set with 4 records:

When we bring that data set into Tableau and build a text table, though, we only see 3 rows:

If we want to show all 4 underlying records as 4 rows in the Tableau text table we have to jump through a couple of hoops, the rest of this post describes why Tableau behaves that way and how to fix it.

The Data is Too Tall

There are all sorts of resources about working with data that is “too wide”, for example the old Preparing Excel Files for Analysis KB article, the new Pivot feature introduced in Tableau v9.0, or this post on Tiny Habits from Emily Kund with commentary from yours truly. Too wide data has too many columns for the kind of analysis that we want to use. There aren’t so many resources on “too tall” data, of which this is an excellent example.

To explain what “too tall” data is, let’s first look at the data:

What is the grain of this data? In other words, what combination of field(s) makes a unique record in the data?  We might be tempted to say Group, Color, and Size, but for Tableau there is no difference between the first two records:

Effectively the data has no unique grain. Yes, there’s a difference in position between these two records but that is not detectable by Tableau because record order (position) is not something stored in each record. This highlights something I talk about in my training classes: the difference in mental models between Tableau and WYSIWYG tools like Excel. Tableau approaches data as a database does, and the default behavior in databases is that record order doesn’t matter. The reason databases abstract record order away is to get higher performance.

So when we bring this data into Tableau and create a view Tableau’s default behavior is to aggregate the data to the level of the dimensions in the view (i.e. on all Shelves and the Marks Card except for Filters). Here’s what happens we bring all the fields in this data set into the view as dimensions:

There aren’t enough dimensions to separate out the two A/Red/Small records. This explains what I wrote earlier about the data lacking enough dimensionality. What we really need is another column (field) to identify the records. So we now have a simple definition:

  • “too tall” data has too few columns to effectively perform the analyses we want
  • “too wide” data has too many columns to do effectively perform the analysis we want

The rest of this post describes three ways to show all the records: Show Underlying data, editing the source, and constructing a specific Tableau view.

Do You Need to Show the Data in a View?

If you don’t need to show the data in a Tableau view users can still view the underlying data in both Tableau Desktop and from Tableau Server & Online. Here’s the underlying data in Tableau Desktop:

And on Tableau Server:

So some user education might be all you need to show all the records. If the data is too tall and you do have to show a view with all the records then you can alter the source data or set it up in Tableau.

Do You Control the SpiceSource?

If you have control over the source data then many sources have features to add a unique record identifier that would add that necessary column to make the data not too tall, not too wide, but just right. For example Excel has the ROW() function:


Creating a view with this that shows every record is trivial, we just need to add Row ID as a dimension:

If you’re not using Excel then you’ll need to look for a function that adds a row ID, record ID, etc. Part of why this is a rare problem is that most relational data tables are set up with unique keys (indexes) that give us those unique values to draw tables. Where I typically see too tall data coming from is from hand-entered data sources and ancient systems.

When you don’t have that option and you’re stuck with too tall data we can still get a view showing every record in Tableau.

Building a Tableau View Showing Every Record for Too Tall Data

There are three main steps to building a view to show every record:

  1. Turning off aggregation so Tableau will return every record from the data source.
  2. Creating a table calculation to increment over each record and provide a unique identifier.
  3. Using that table calculation as a discrete pill to sort the view.

Here’s how using the above data source:

  1. Turn off Analysis->Aggregate Measures:

    The view now looks like this:

    The reason why there’s a lot of white space is that Tableau is now returning multiple records (the two 1’s) for A/Red/Small and has turned on Mark Stacking by default. This is not a problem, we’ll be rearranging the view later on to get rid of Mark Stacking.
  2. Create a Rank calculated field with the following formula:
    RANK_UNIQUE(MIN([Number of Records]))

    I use RANK_UNIQUE() here instead of INDEX() because rank only counts non-Null values and should there be any unwanted densification those ranks will return Null, whereas INDEX() would return values that would throw off the desired ordering.

  3. Drag the Rank field to the Level of Detail Shelf and set the Compute Using to an Advanced… Compute Using where all the dimensions are used for addressing in the order that you want the records to appear:

    Something I’ll typically do at this point to validate is to add the table calc (Rank) to the text Shelf or Measure Values (here I have it on text):
    And we can see that the Rank is accurate.
  4. Turn Rank into a discrete (blue) pill:
  5. Drag Rank to the Rows Shelf to the left of all the dimensions. With the unique identifier for each record (mark) the Mark Stacking goes away:
  6. As the last step turn off Show Headers for the Rank pill:

    The view now shows each individual record:

Conclusion

Tableau is designed to help us dive & swoop through thousands/millions/billions of rows of data to discover insights so Tableau’s default behavior is to aggregate the data. Tack on Tableau’s mental model of treating data as a database does and a task like showing every record can be more complicated when the data source isn’t aware of more modern database concepts and lacks the necessary dimensions to uniquely identify each record. A feature request for row numbering has been created to make this easier, vote it up if this is something that interests you!

Here’s a link to the too tall workbook on Tableau Public.

An Exploration of Custom Color Palettes

This post is an exploration of why the two views above look different even though the red for 100% is the exact same for each, as in South Dakota for 2013 Q4:
Screen Shot 2016-02-07 at 7.18.31 PM

Screen Shot 2016-02-07 at 7.20.00 PM

I recently had the opportunity to dive into how Tableau assigns colors, as the goal for this particular worksheet is to make all the 0.0%’s have a white background so the rest of the colors have a little more breathing room. I came out of it impressed with the work that Tableau’s color designers (Maureen Stone and others) have done to create good looking color palettes in Tableau. Read on for some details on how to build your own palettes.

Continue reading

TDE or Live? When to Use Tableau Data Extracts (or not)

I recently answered a question for a new Tableau user on when to use a Tableau Data Extract (TDE) vs. a live connection, here’s a cleaned-up version of my notes:

Why Use a Tableau Data Extract?

My preference is to first consider using a live connection because extracting data adds another step to the data delivery chain. However there are many situations where that isn’t a workable solution, so Tableau has created Tableau Data Extracts to support situations where a live connection to the source is:

  1. Not possible. Sometimes a Tableau viz can’t have live connection to a production system, for example when you want to share a viz with someone not inside your premises. The extract can be published (whether in a viz or as a published data source) to Tableau Server or Online, or saved in a Tableau packaged workbook (TWBX) or packaged datasource (TDSX), or sent “naked” as a TDE file.
  2. Too slow. There are a number of variations on this:
    1. For example a production system is on a slow network connection so a TDE can be created locally and only have to go over the slow network.
    2. Because data extracts are highly optimized for queries they can be much, much faster than a live connection. I regularly see 100x improvement in load times using Tableau data extracts over MS Access, to the degree that my muscle memory is tuned to making an extract as the first thing I do after connecting to an Access-based source.

      Note that older posts (prior to the release of Tableau v8.2) on extracts will talk about them being faster than raw Excel/text connections because at the time the “legacy” aka MS JET engine was used. That is no longer the case with the new Excel/text connector.  The new connector takes advantage of Tableau’s data extract (data engine) technology to create a data extract in the background, that’s why the first connection can be slow and then creating an extract can be instantaneous.

    3. The Tableau queries to the live connection might slow down operational queries too much, so having Tableau only query at scheduled extract refresh times is preferable.
    4. Data volumes could be such that millions of records per week of raw data that would be too slow to run live Tableau queries on might be aggregated in a TDE down to dozens or hundreds per week based on some set of categories/dimensions in the data.
  3. Unable to handle the record volumes. MS Excel is limited to 1M records, MS Access tops out anywhere in the 100s of thousands to couple M records depending on the complexity of the table, etc. whereas a TDE can potentially handle billions of records. Another case is situations where the data is stored in multiple tables (potentially across multiple data bases) and a UNION query is used to generate a result that is too big for a live connection but fine for a TDE.
  4. Exposing too much data. There are four cases where extracts can effectively improve security by reducing what data is made available:
    1. We can create extract filters on TDEs so only the necessary records are included.
    2. We can set up the extract to only include fields used in the workbook, in other words we can exclude columns from the extract.
    3. Extracts can be configured to aggregate the data and therefore hide record-level detail.
    4. For file-based sources when we include the files in a TWBX it’s the whole file, so for an Excel file that means that every worksheet in that file is included in the TWBX. If we extract the data then only the necessary data for the workbook is in the TDE.
  5. Unable to handle the data volumes. A related case is that since a TDE is highly compressed it can be a lot smaller than the original uncompressed source. I’ve seen people use TDEs instead of file-based sources to make distribution of packaged workbooks easier.
  6. Not supporting certain calculations. Tableau data extracts have generally supported more functions than any particular data source (with the exception of RAWSQL functions). One example is that in the “old days” before Tableau 8.2 with the new Excel/text connector we were stuck with the MS Jet engine for connecting with Excel & text files and that couldn’t handle COUNTD(), MEDIAN(), In/Out of Sets among other drawbacks, so we’d create an extract. Another example is that currently not all sources support the Level of Detail Expressions introduced in v9.0 and again we can work around that by creating an extract.
  7. Unable to handle the complexity. There are various computations (such as using top and conditional filters, nested calculated fields, etc.) that TDEs can handle in combined ways that some data sources can’t. For example MS Access databases are one of my main data sources and in some Tableau worksheets if I switch from the TDE to the live connection the MS JET engine gives me a “query too complex” error.
  8. Actually a situation where multiple file-based sources needed to be put together…with TDEs it’s possible to add data to an extract from multiple file-based sources, which can be handy when you are integrating data from various producers at different times. Tableau is working on improving this: At the 2015 Tableau Conference they demoed a feature for creating federated queries across multiple data sources (including server-based sources, other TDEs, etc.). From what I saw Tableau will be able to do this in a live connection, however I’m guessing that we’ll often want to be using TDEs for performance reasons.

Other Features of Tableau Data Extracts

A few other advantages of TDEs are:

  • Materialized expressions. Tableau will “materialize” record-level calculations that use only fields from a single data source and are not dependent on run-time values — i.e. not using TODAY(), NOW(), USERNAME(), ISMEMBEROF(), or a parameter — as fully indexed & compressed fields in an extract. This can improve performance in many cases, for example when splitting name or address fields and/or creating datetime fields out of strings.
  • Access to cloud-based data sources. In order to make cloud-based sources such as Salesforce.com, Google Analytics, oData, and the Tableau Web Data Connectors useful for the kinds of at-the-speed-of-thought analytics that Tableau enables we have to use Tableau data extracts. Other cloud-based sources such as Amazon Redshift, Google BigQuery, and Microsoft Azure can be used as a live connection or extracted as needed.
  • Option to publish to Tableau Public. For performance reasons we can only use TDEs when publishing to Tableau Public.

TDE Limitations

However, Tableau Data Extracts do have some limitations and there are cases when they are not suitable or more difficult to work with than a live connection:

  1. TDEs are by definition not a live connection to the source. This means that Tableau Data Extracts are not usable if you’re needing “real-time” data in your Tableau viz. Also if the refresh time of a TDE is more than the desired data refresh time then TDEs aren’t really feasible.
  2. Tableau Data Extracts can’t be created from OLAP sources such as Oracle Essbase or SSAS. They can be created from SAP BW cubes, however.
  3. Changing the data structure of the underlying data can require rebuilding the entire TDE, which may not be very easy, take too much time, become impossible if the file-based source you used for an incremental append is no longer available, etc.
  4. Tableau’s support for incremental loads, slowly changing dimensions, and updates to existing rows is minimal to non-existent.
  5. Tableau Data Extracts do not support RAWSQL functions, nor can we use Custom SQL on an already-created extract. One use case for RAWSQL is when the underlying data source supports a given function and Tableau does not yet support that feature for that source.
  6. TDEs can become too slow to refresh and/or queries on them become too slow based on the data structure, here are some known factors:
    1. many rows (anywhere from millions to billions)
    2. many columns (when they get into the hundreds)
    3. lots relatively non-compressible (high-cardinality) columns
    4. many complex materialized expressions

      So a billion-row extract might be plenty fast and a million-row extract on a complex data structure might be too slow, your best bet is to do your own testing.

  7.  As of this writing (January 2016) I haven’t heard of anyone else being licensed to read from TDEs so the only pieces of software that can read from TDEs are Tableau Desktop, Tableau Reader, Tableau Server, Tableau Online, and Tableau Public. There’s no published API for reading TDEs and trying to save large CSVs from a Tableau worksheet is likely to run into out-of-memory problems so if you’re looking for more permanent storage for data so you can get at it later you’re likely to want to look elsewhere.
  8. Refreshing TDEs puts more and more load onto Tableau Server and that can impact delivering visualizations, so doing the work to make the underlying source fast enough to use a live connection may be preferable to the extra hardware & configuration needed to make the TDE refresh fast enough.
  9. TDEs don’t include user-level security, those have to be set up higher up in the stack in the Tableau Server data source and/or Tableau workbooks that use the TDE, which means there’s extra work to prevent unauthorized users from getting access to the data in the Tableau views and the TDE itself. It may be better to implement that security in the raw data source (which I know makes my DBAs happy because they get to retain control).

To eliminate and/or work around the performance limitations of TDEs I see people doing one or more of the following:

  1. Read Designing Efficient Workbooks by Alan Eldridge and implementing the suggestions there, it’s the [insert holy-book-of-your-choice metaphor here] for Tableau performance tuning.
  2. Create multiple data sources on the same underlying data, the basic distinction is using a fast & lightweight TDE for the high-level views and then the detail reached via drill-down (i.e. Filter Actions) is stored in a big, relatively slower TDE or live connection.
  3. Use ETL tools such as Alteryx or Trifacta to pre-compute, pre-aggregate, and transform the data to make it fast in Tableau (and potentially use a TDE).
  4. Do the necessary performance tuning in the existing data source fast enough to use as a live connection.
  5. Deal with high volume/high performance requirements by creating a new data source whether that be a tuned datamart/data warehouse/data lake or using something like Teradata, Vertica, Hadoop, Exasol, etc.

Conclusion

Thanks to Brian Bickell for To Extract or Not to Extract (published 2014-04-29) and Tom Brown for Tableau Extracts (published 2011-01-20), those posts helped validate and round-out bits that I’d missed. Also thanks to Alan Eldridge for Designing Efficient Workbooks, it’s on my “must read” list of Tableau resources. If you have other pros & cons of extracts, please let me know!

At the Level – Unlocking the Mystery Part 2: Rank Functions

Many moons ago I did a first post exploring the non-obvious logic of the most secretive of Tableau table calculation configuration options: At the Level. A few weeks ago I was inspired by a question over email to dive back in, this post explores At the Level for the five rank functions: RANK(), RANK_DENSE(), RANK_MODIFIED(), RANK_UNIQUE(), and RANK_PERCENTILE(). The rank functions add a level of indirection to the already complicated behavior of At the Level and I don’t have any particular use cases, so…

If you are like me and won’t rest until you understand every detail of Tableau’s functionality, then this post is for you. Otherwise you may find this post unhelpful and/or confusing due to extreme table calculation geekery. You have been warned.

The particular challenge with ordinal functions like INDEX(), FIRST(), and the rank functions is that we absolutely have to understand how addressing and partitioning works in Tableau, and then we tack onto that an understanding of how the calculations work, and finally we can add on how At the Level works. For the first part, I suggest you read the Part 1 post on At the Level, it goes into some detail on addressing and partitioning. To understand the rank functions here’s the Tableau manual for table calculations (scroll down to the Rank functions section). Finally, read on for how At the Level works for rank functions.

Continue reading