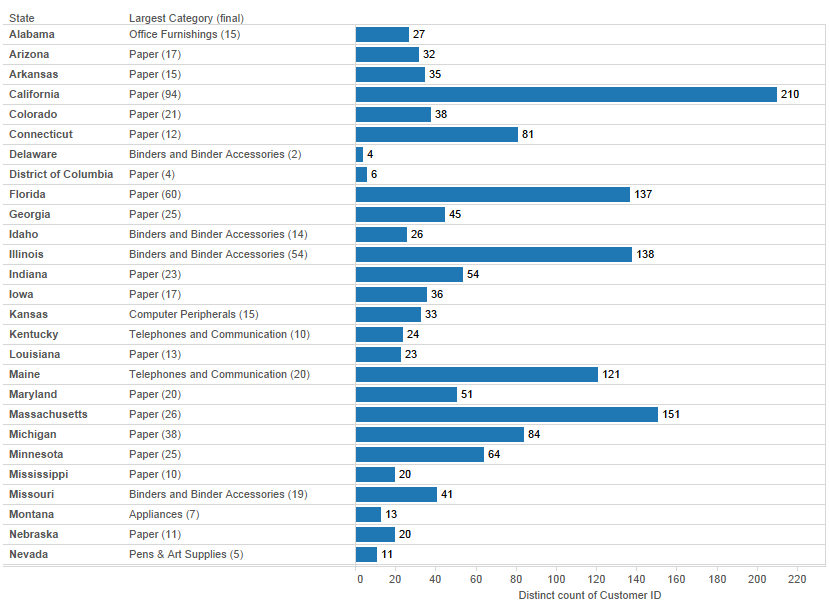
Last week Mark Jackson had a great post on using Tableau v9 Level of Detail expressions to find a dimension at a lower level (with an update here). In his Superstore example where there are multiple Categories in each State, the goal is to show a view of each State with the largest Category in that State based on the number of customers, like this:
 In this remix post I’ll demonstrate an alternative solution that doesn’t require any string manipulation, along with going through my current process for building & verifying LOD expressions.
[Post edited 20140527 to include links to Mark’s update to his original post.]
Finding the Largest Category in Each State
Here’s the algorithm I use for this kind of calculation, I use this pattern pretty regularly because most of my work is done in MS Access where we don’t have more advanced features like partitioning and row numbering functions.
- Get the CountD(Customer ID) per Category and State. In MS Access this is done via a couple of nested aggregate subqueries (since Access doesn’t have a CountD() function either), in Tableau we can do this with an LOD expression.
- Get the maximum of that for each State. This is done as another query in Access, in Tableau it can be another LOD expression.
- Join the results from step 1 and step 2 back to a query at the level of Category & State. This requires yet another query in Access, in Tableau this is a built-in feature of LOD expressions.
- Write a calculation that determines if there’s a match between the calcs, then return the appropriate Category.*** This is an IIF() statement in Access, in Tableau we can use IIF() or IF() to write the calculation.
- Return the result from step 1 to the final query (Access) or the view (Tableau).
*** There’s a complication with ties that I’ll cover further down.
If you’ve written SQL aggregate queries, you’ve had practice in breaking down the higher-level goal into smaller and smaller chunks until each chunk can be expressed as a single computation at a given aggregation. And when working with SQL as part of that you’ve had practice in imagining what the query is doing prior to seeing the results, and (if you’re at all like me) have had tons of practice in figuring out where things went wrong when the granularity of the data vis-a-vis the GROUP BY fields, joins, and when calcs were performed made too many rows, too few rows, or just plain wrong results.
Where LOD expressions get brain-twistingly complicated for people who haven’t had experience writing tons of SQL aggregate queries is that they haven’t had that practice in breaking things down, *plus* in Tableau the aggregations that LOD expressions compute are only visible as results.
Building and Validating LOD Expressions
The process I use tries to make it very clear what the LOD expression is doing when so I can build LOD expressions that work in each step of the process. This uses a similar process to Mark’s other post from last week on Incremental Development in Tableau where we work in smaller steps and validate each step as we go.
1. Figure out the dimension(s) that I want in the view.
“In the view” means on Rows, Columns, Pages, and the Marks Card. The Filters Shelf is not included because filters don’t change the granularity/level of detail of the view.
In this example, all I want in the view is State as a dimension.
2. Start a workout view with those dimension(s) and any regular aggregates i.e. non-LOD calcs:
Here’s State in the view, showing only US states and the COUNTD(Customer ID) at the State level:

3. For each LOD expression, figure out the dimensions that are in play for that LOD expression.
Some important points:
- FIXED LOD expressions only have the dimensions specified in the LOD expression.
- INCLUDE & EXCLUDE LOD expressions use both the specified dimensions plus any dimensions in the view (the vizLOD), and furthermore if nested inside one another the inner expressions include/exclude dimensions from the outer expressions.
- Regular dimension filters will apply *after* FIXED LOD expressions but before INCLUDE & EXCLUDE LOD expressions, so the default for FIXED LOD expressions is that they are computed across all the data. To filter dimensions prior to computation of FIXED LOD expressions we have to use context filters.
Working this out can take some effort but it’s absolutely necessary to ensure accurate results. Like anything that we do on a regular basis, with practice this can become second nature. In Mark’s update he describes Joe Mako’s current technique for figuring this out using a spreadsheet that lists the dimensions, their values, and uses color-coding for included & excluded dimensions.
In this example, the only additional dimension is Category, so the dimensions are State & Category.
4. Start an LOD workout view with those dimension(s). Then put the LOD expression into that workout view and apply a couple of different aggregations such as SUM and AVG.
In the case of strings you can use MIN and MAX for validation. If each aggregation returns the exact same result, then you can be mostly sure that you’ve got the right dimensionality in the LOD workout view. I write “mostly” because there are dependencies on the granularity of the data that crop up as you get into nested LOD expressions as well as the main view.
Here’s the first LOD expression that returns the COUNTD(Customer ID) per Category for each State:
{INCLUDE [Category] : COUNTD([Customer ID])}
And here’s that calc in a view with State & Category as dimensions. We can see that COUNTD(Customer ID) is the same as the SUM, AVG, and MAX of our LOD calc:

6. Repeat steps 3-5 for each different LOD expression and/or different level of detail.
For example, if you are nesting LOD expressions at multiple levels of detail, that can mean putting the same calculation into multiple workout views to see what it’s returning. In order to validate what INCLUDE & EXCLUDE LOD calcs are returning to the data prior to the aggregation at the vizLOD, you can highlight marks and use right-click->View Data->click on Underlying tab to see what they are returning (there’s an example of this below). Then you’ll also need to pay attention to how each LOD expression is aggregated in the different views.
In our case the only other granularity is that for the main view, the State, so we can skip this step.
7. Once you have the calcs working in the individual views, bring them one by one into the main workout view. Verify that they are returning the desired results.
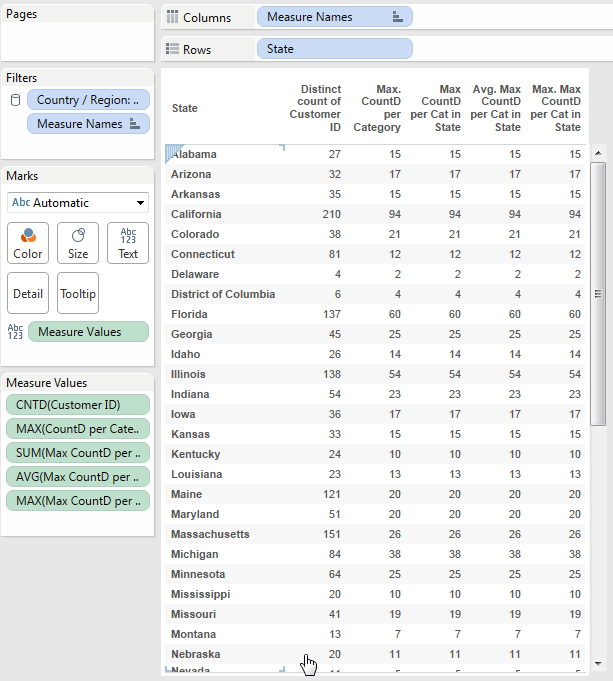
Here’s the CountD per Category in the main view with those same aggregations:

Since the goal is to return the max COUNTD(Customer ID) for each Category, the MAX(CountD per Category) works. But we don’t want that to be returned as an aggregate in the view, we want that as a record-level calc so a comparison can be made. The following Max CountD per Cat in State calc does that:
{INCLUDE : MAX([CountD per Category])}
This uses a little trick in LOD calcs where by not including any specific dimensions we can force an aggregation at the level of detail of the viz (i.e. State) and still return that as a record-level result.
Here’s that calc in the workout view at different aggregations, showing it is returning the same result for each version:
Now for step 4 in the algorithm I laid out. Here’s the formula for the Largest Category (initial) calc:
IF [CountD per Category] == [Max CountD per Cat in State] THEN
 [Category]
END)
This calc takes advantage of a second trick with LOD calcs that I hadn’t known about until reviewing #8 in the Top 15 LOD Expressions. While we can use the results of a FIXED LOD expression in the view as a dimension or aggregated measure, in the view we can only use INCLUDE & EXCLUDE LOD expressions as aggregated measures. *However*, just like FIXED LOD expressions the results of INCLUDE & EXCLUDE expressions are returned at a record-level *and* can be evaluated at a record-level. So the IF statement evaluation is only True when for a given record the CountD per Category for that record’s Category is also the maximum value in that record’s State, and the calc returns the Category for those records.
Note that Tableau automatically applies the Count aggregation in the Data window, indicating that this calc has to be aggregated in some way in a view:

Because we’re using a mix of calcs meant to work at different levels of detail here, validating this gets a little tricky. We have to use the View Data->Underlying tab technique to see what’s going on, here I’ve selected Alabama:

We can see that the Largest Category (initial) calc is returning results for both Office Furnishings and Paper. This is because there’s a tie with both having 15 distinct customers. If we wanted to show all the ties we’d run into a key difference between INCLUDE & EXCLUDE vs. FIXED, namely that INCLUDE & EXCLUDE LOD expressions *have* to be aggregated in a view, and since the view is at the level of detail of State that meants the aggregations of MIN(), MAX(), etc. all only return a single result, not every result. So there’s no way to use the INCLUDE & EXCLUDE to show the ties, I’ve got a follow-up post in the works that describes how an alternative calc using FIXED can show all the ties.
To resolve that tie for now, we’ll use the MIN() aggregation:

To build the Largest Category (final) calc I chose to apply that aggregation in the calc (that way Tableau won’t be adding anything to the column name in the view) and we’ll add in the CountD per Category as part of as string to show that as well, so it will look like “Office Furnishings (15)” for Alabama. Here’s the formula:
MIN(IF [CountD per Category] == [Max CountD per Cat in State] THEN
 [Category] + ' (' + STR([CountD per Category]) + ')'
END)
Here’s the calc when looking at the Underlying Data:

And in the view
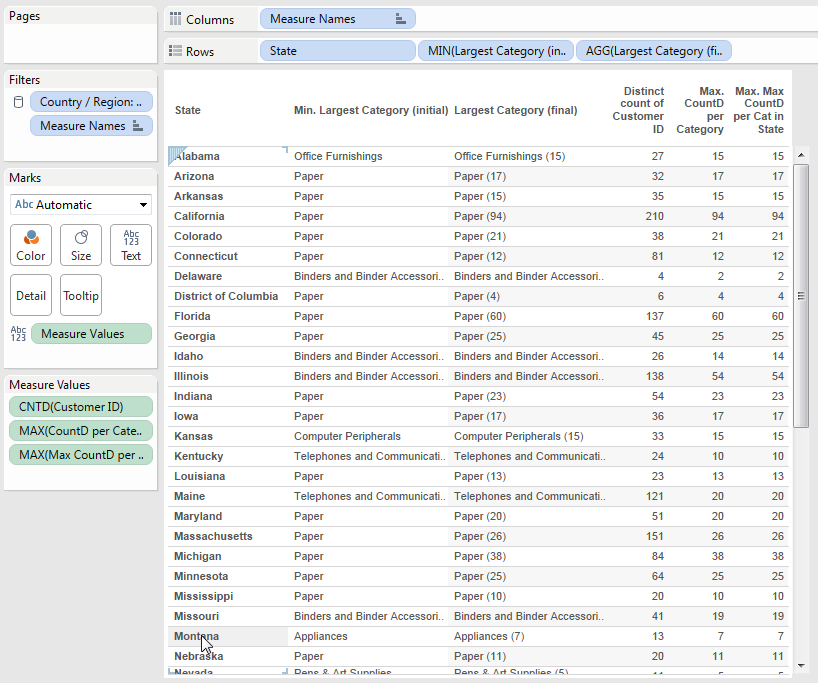
Building the final worksheet is a matter of dragging and dropping pills to remove the unneeded measures and generate the final chart:

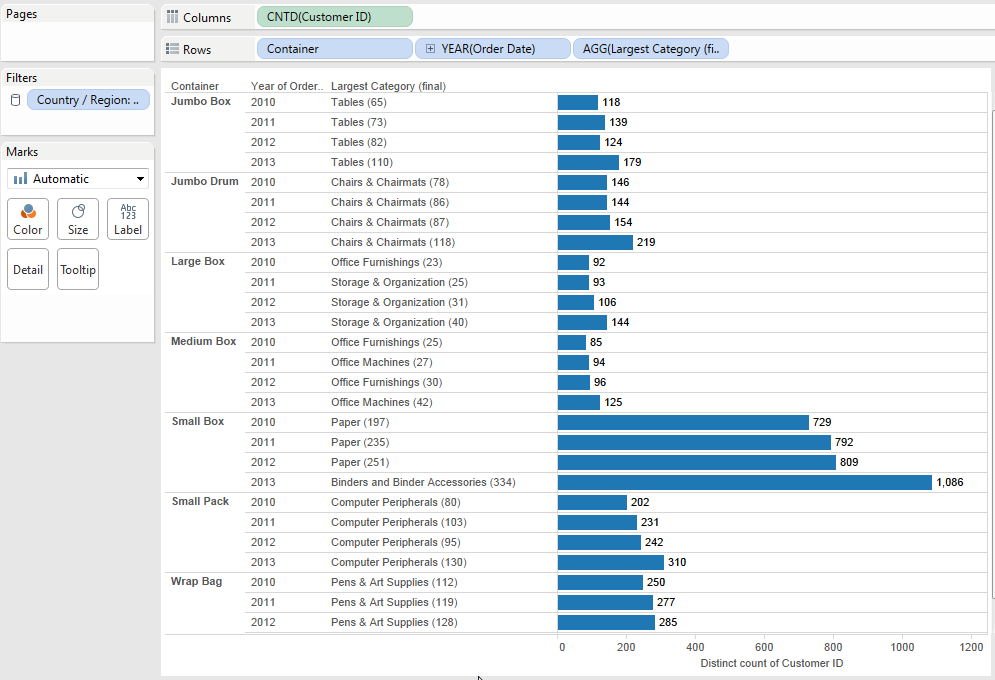
Why stop here, though? One key feature of using INCLUDE & EXCLUDE LOD expressions is that the results are dependent on the dimensions in the view. We can take advantage of that (and all the work we’ve done) and simply drag & drop dimensions. Here’s a one-click change to finding the largest category for each Container:

And we can have multiple dimensions, here I’ve added the YEAR(Order Date) to the view with one more click:
 For those readers who have experience using Tableau table calculations, this last bit is incredibly awesome. We could have built any of these views with table calculations, but switching out dimensions would likely break things so every new view would have to be hand-crafted and revalidated, whereas with LOD expressions we can be back in the flow of dragging & dropping pills to ask more questions of our data.
Here’s the Return a Lower Level Dimension from an LOD Expression viz on Tableau Public.
Conclusion
This post described an alternative algorithm for using LOD expressions to return a dimension from a lower level (finer granularity) into a higher granularity, how to work with LOD expressions in a stepwise fashion so you can validate each step of the way, and demonstrated a couple of lesser-known aspects of LOD expressions: using INCLUDE or EXCLUDE without a dimension, using results of INCLUDE or EXCLUDE to do record-level evaluations, and finally how easy it can be (once you’ve done the heavy lifting) to rearrange views using LOD expressions. I hope it’s useful for you, if you have any comments, questions, or other tips, please comment below!
Thank you for putting this together, Jonathan. It is helpful to not only see _how_ to do something, but the entire thought process behind it.
Thanks! In the last couple of weeks I’ve had a breakthrough in teaching how to think about creating calculations, this is one of my attempts at applying it to how to “think Tableau.”
A fantastic post Jonathan. I’m still trying to wrap my head around the awesomeness that is LOD calculations, and posts like this really help lessen the mental leakage. 🙂 I read Mark’s post (with Joe’s addendum) but found this article to be a bit clearer. You arrive at what appears to be the same result (sans the duplicate tagging) with a simpler set of calcs. I’m sure I’ll appreciate the other methods eventually, but this article got me one solid step further on my journey. Thank you.
Pingback: Extending LOD Calcs with Table Calcs | VizPainter
Hi Jonathan,
Thanks for this great post! I want to know something on the same lines – show dates but the values should be at month level and for the last 3 months (excluding current month).
If you can look at the issue here and suggest some way to achieve this, that would be helpful-
Thanks!
Sorry, forgot to add the forum link earlier –
https://community.tableau.com/thread/195533
Thanks!
I’m trying to create a Span of Control report and the fixed statement does not return the correct count of direct report for me, only the include statement does but using the include statement I can not convert it to a dimension. Does anyone know of a workaround. : (
Hi Than, INCLUDE LODs can’t be used as a dimension so you’d be better off fixing the FIXED LOD. Most likely there are filters that are not affecting the FIXED LOD, you’ll need to make sure that any filters that need to affect the FIXED LOD results are added to context. If that doesn’t solve the problem then post a more detailed explanation to the Tableau forums at http://community.tableau.com and link back to it here so I can take a look.
Jonathan