Tag Archives: v10.0

Row Level Security Using Tableau 10.0 Cross Data Source Filters by Jamieson Christian

Jonathan here. Serendipity is a wonderful thing! I was briefly on the Tableau community forums last week and found this thread where Jamieson Christian described a new method for user- row-level security in Tableau that I hadn’t seen before, and it’s so awesomely cool I asked him if he could blog about it, and he accepted my invitation! I’ve already implemented this method at a client and it brought a dashboard from unacceptable refresh times to nearly instantaneous. So read on for Jamieson’s description.

Row level security often presents challenges, if your security data is not in the same data source as your main data. In such cases, solutions tend to leverage one of four techniques:

  1. Data prep outside of Tableau – often involves cross products that can make data sets unacceptably large.
  2. Passing parameter-based filter through Tableau’s Javascript API – requires using a portal that is not always feasible for organizations, also won’t work with Tableau Mobile.
  3. Data blending — just about the only in-Tableau option prior to Tableau 10.0.
  4. Cross data source joins — available in Tableau as of Tableau 10.0.

This post introduces a 5th option using a cross data source filter. see below for how to set it up!

Continue reading

Multiple Ways to Multi-Select and Highlight in Tableau

Last year in version 10.0 Tableau introduced the highlighter that lets us quickly highlight marks. It’s got two potential limitations, though:

  1. We can only highlight a single value or all marks meeting a search criteria, not multi-select values.
  2. Tableau’s Highlighter (and Highlight Actions) are hard-coded so we don’t have control over the formatting of the highlighted marks.

We can work around those limits in a few different ways:

  • Using a separate worksheet with Highlight Action(s) enabled with Hover or Select.
  • Using a separate worksheet with Highlight Action(s) enabled, a dual axis, and a duplicated dimension to display different marks. This technique was developed by Rody Zakovich in his post Only Color Marks on Dashboard Highlight .
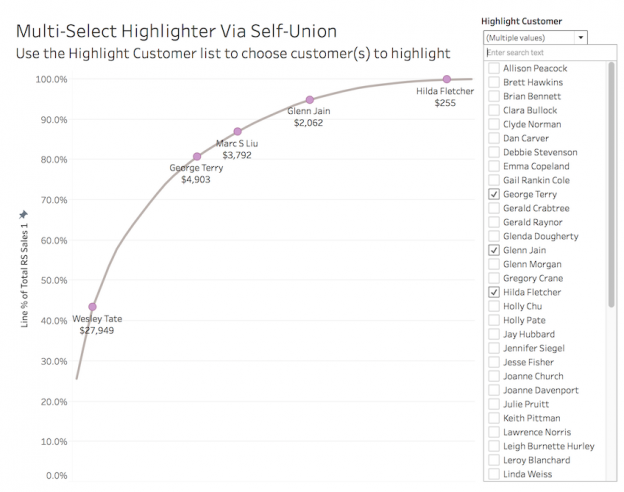
  • Using a self-union’ed data source and a dual axis to get total control over how the highlighted marks are displayed and have more control over the user interface for choosing the highlighted marks. I think I might have invented this technique, I haven’t seen anything quite like it before. This method lets us build views like this:

Read on for how to build these out and choose the right method for you!

Continue reading