LOD Expression Remix – Finding a Dimension at a Lower Level

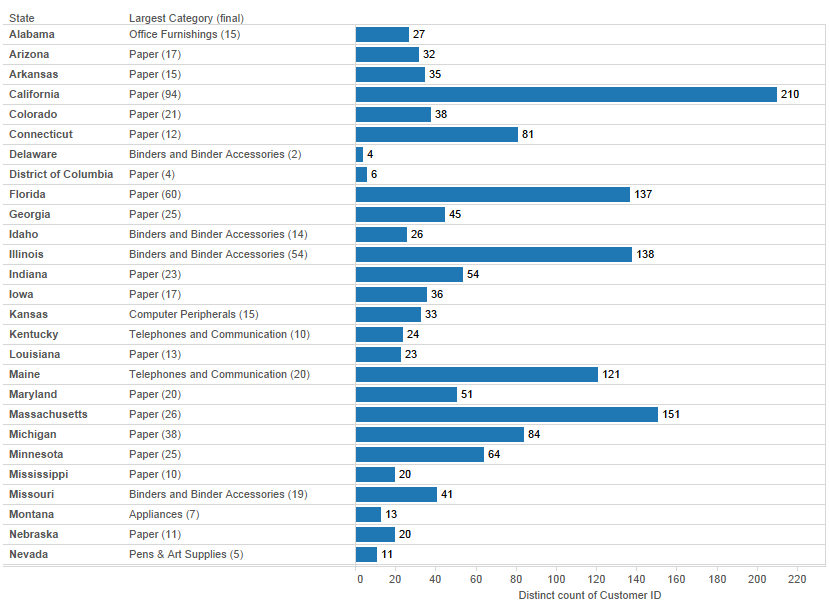
Last week Mark Jackson had a great post on using Tableau v9 Level of Detail expressions to find a dimension at a lower level (with an update here). In his Superstore example where there are multiple Categories in each State, the goal is to show a view of each State with the largest Category in that State based on the number of customers, like this:

2015-05-27 10_43_52-Tableau - return lower level dim from LODIn this remix post I’ll demonstrate an alternative solution that doesn’t require any string manipulation, along with going through my current process for building & verifying LOD expressions.

[Post edited 20140527 to include links to Mark’s update to his original post.]

Continue reading

Counting from Nothing – A Double Remix (or, Partitioning via Table Calculations v2)

Over on the Tableau forums Alexander Mou answered a thread on generating a count from sparse data, and the solution he came up with is found in his blog post Dynamic Histogram Over Time. In this post I’m diving into some details of what Alexander did, coming up with a couple of alternative remixes of that solution, and describing a couple of different ways to effectively partition a table calculation via another table calculation. Read on for details!

Continue reading

So You Want to be a (Tableau) Zen Master

So You Want to be a (Tableau) Zen Master

As usage of Tableau grows there’s a question that comes up more and more often: How can I become a Tableau Zen Master? It’s quite natural that people would ask for that question, and since we Tableau users are analytically-minded we tend to start looking for something like a checklist.

I’ve been thinking about how to answer this question for several months now. I think I have an answer, and it’s not a checklist. Please know that I’m not writing or speaking for Tableau the company here, just using my own insight and what I’ve gathered from conversations with others both inside and outside Tableau.

One part of being a Tableau Zen Master is demonstrating excellence in one or more areas of working with Tableau, and towards that I published Getting Good at Tableau. Another part is helping the Tableau community, and Steve Wexler has published a great series of posts on that (1, 2, 3). And another part is a way of doing and being, and to communicate that I put together the following presentation (with a little help from my wife, as you’ll soon find out):

If you find this helpful (or not), please let me know!

Tableau Brain Teaser – Coloring the Boxes in Box-and-Whisker Plots

One of the things we’ve been playing with in the Viz Talk section of the Tableau Community forums is posting brain teasers where there’s a problem that has a solution that can (theoretically) be put together in a few minutes. Here’s one from a couple of weeks ago: Headers down below on a grouped bar chart and the latest one is: Can you color the boxes in a box plot to look like this?

Screen Shot 2015-04-18 at 8.00.08 AM

These can be a fun way to learn different ways to think about working with Tableau, and if you’ve got any yourself please add them!