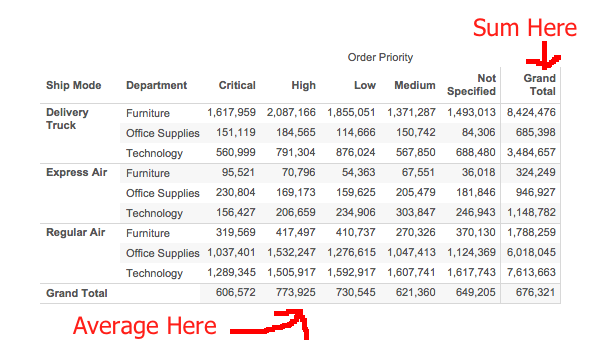
Here’s a how-to based on a recent request in the comments from my earliest custom Grand Totals post. The user asked how to have the Grand Total show a Sum of the measure for the rows and the Average of the measure on Columns, like so:
We’ve got at least a couple of different solutions for this problem, in this post I’ll demonstrate one solution with table calculations that will work with any recent version of Tableau and another with Level of Detail expressions that will work in version 9 onwards.
The Data
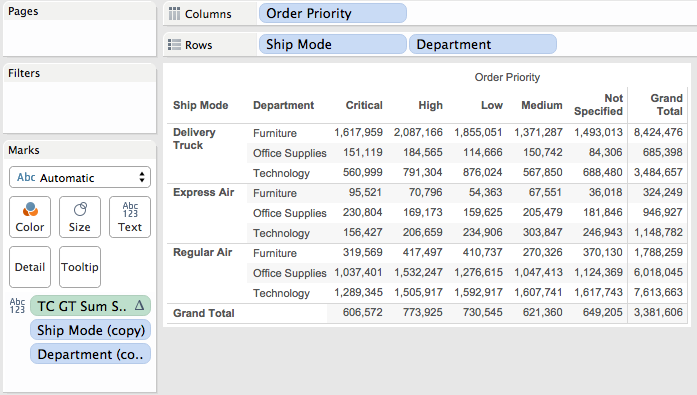
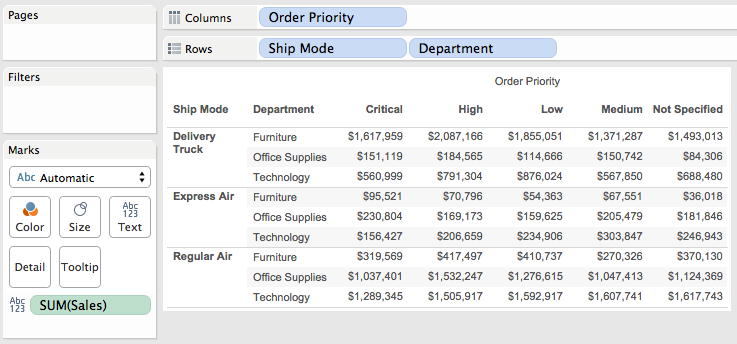
I’m going to use Superstore Sales, with Ship Mode & Department on Rows, and Order Priority on Columns:
The Problem or, Why We Have to Use a Custom Grand Total
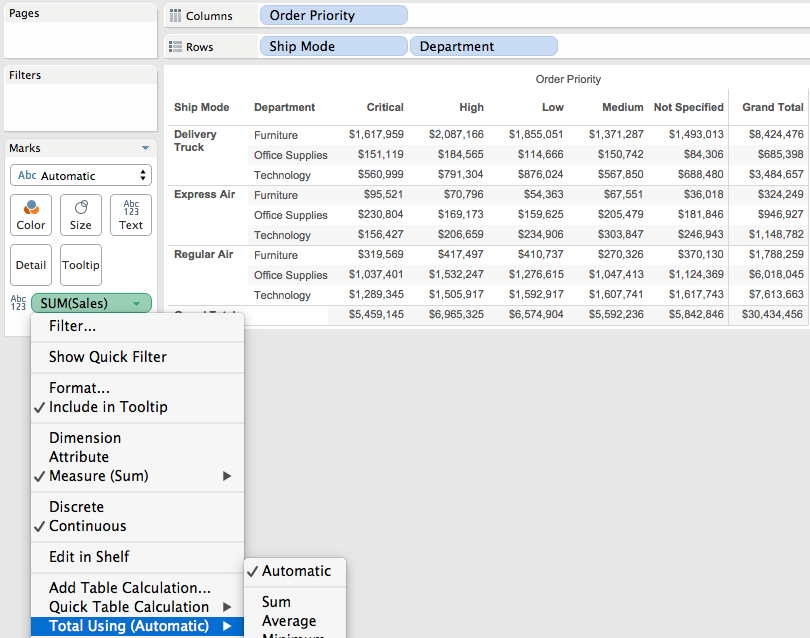
With SUM(Sales) as the aggregate measure, we can turn on Grand Totals for Rows and Columns. The default aggregation for the Grand Total is “Total using Automatic”, which aggregates at a higher level. For the Rows, this is the SUM(Sales) for each Ship Mode & Department. For the Columns, this is the SUM(Sales) for each Order Priority.
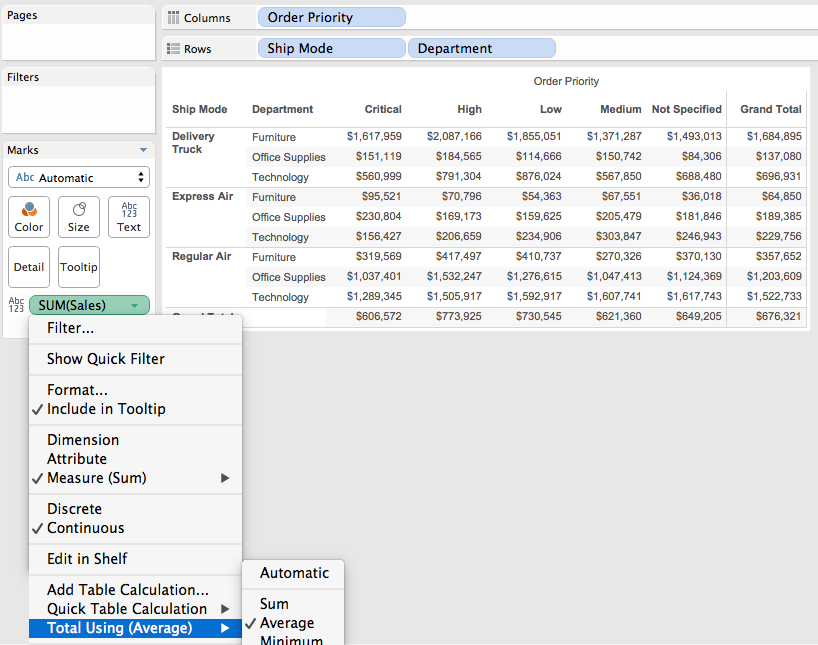
When we turn on two-pass totals to do the average, in the Rows that is the SUM(Sales) for each Order Priority, Ship Mode, & Department then averaged per Ship Mode & Department. In the Columns the total is again based on the SUM(Sales) for each Priority, Ship Mode & Department, then averaged per Priority:
There’s no way to have the two-pass totals stay as the SUM() for the Row Grand total and Average for the Column Grand Total, so we need to build our own custom grand total.
The Double Measure Fail
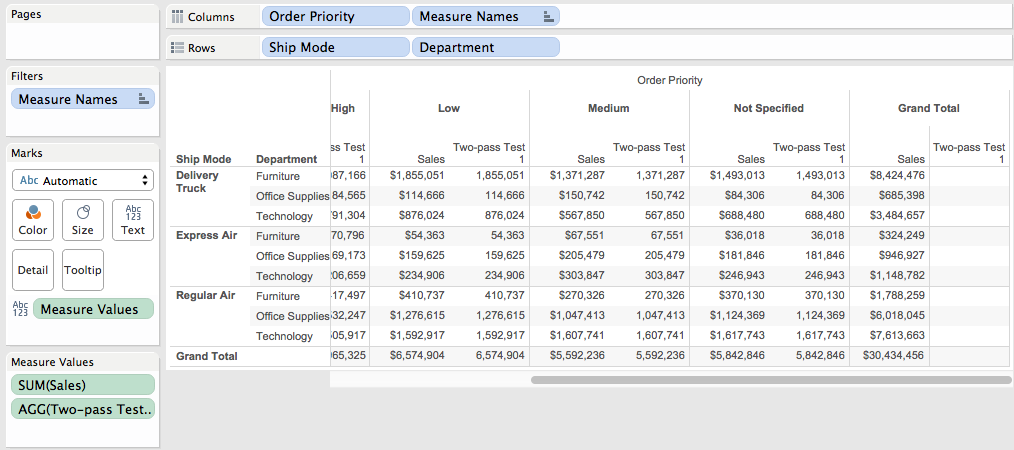
One thought is that we could take advantage of Tableau’s ability to put multiple pills on the Text Shelf, for example we could (theoretically) set up one calc to only return the sum of Sales in the Row Grand Total (and Null everywhere else), and then set up a second calc to return the Sum of Sales in the detail rows and then turn on two-pass totals for Average in the Column Grand Total. Then the marks wouldn’t overlap and would be accurate. Here’s an example Two-pass Test calc, using the MIN/MAX technique from Customizing Grand Totals Part 2:
IF MIN([Order Priority]) == MAX([Order Priority]) THEN
    SUM([Sales])
END
This calc works accurately when we first bring it into the view, it returns Null in the Row Grand Total:
However when we turn on two-pass totals this breaks. I’ve duplicated the Two-pass Test measure here, the first one has the original Total Using Automatic that returns Nulls, the second has Total using Average and it’s now ignoring the MIN/MAX test and returning results in the Row Grand Total:
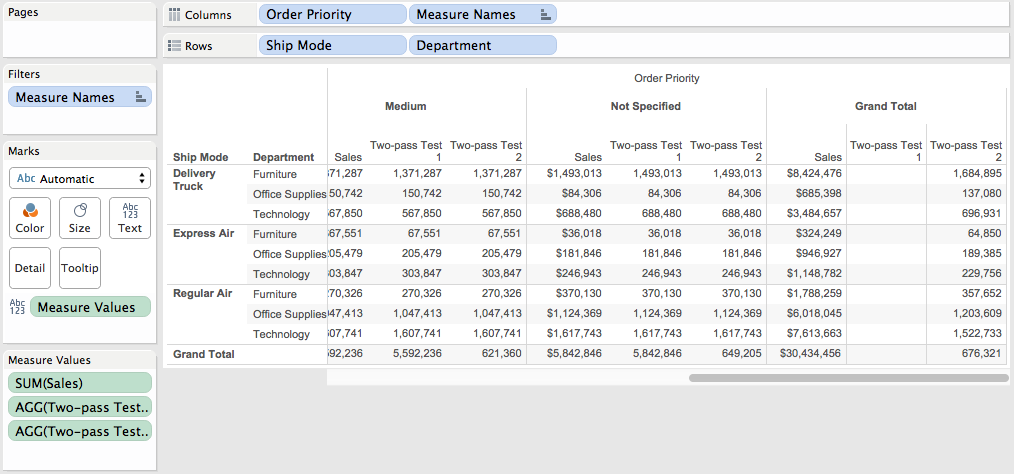
So even though it’s accurately calculating the average in the Column Grand Total it’s also returning a result that we can’t filter out in the Row Grand Total and that makes this unusable. This is an unfortunate “feature” of Tableau’s two-pass totals.
Therefore we have to build our own calculations to do the custom Grand Total, in the rest of this post I show one option for table calculations and a second option that uses Level of Detail expressions.
Table Calculation Solution for Separate Custom Grand Totals for Rows and Columns
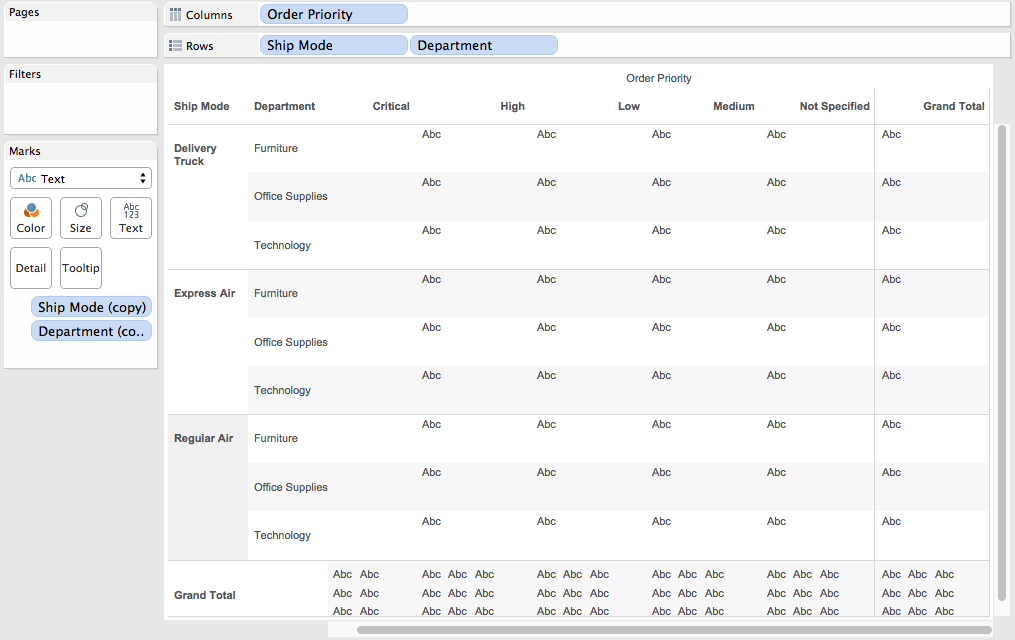
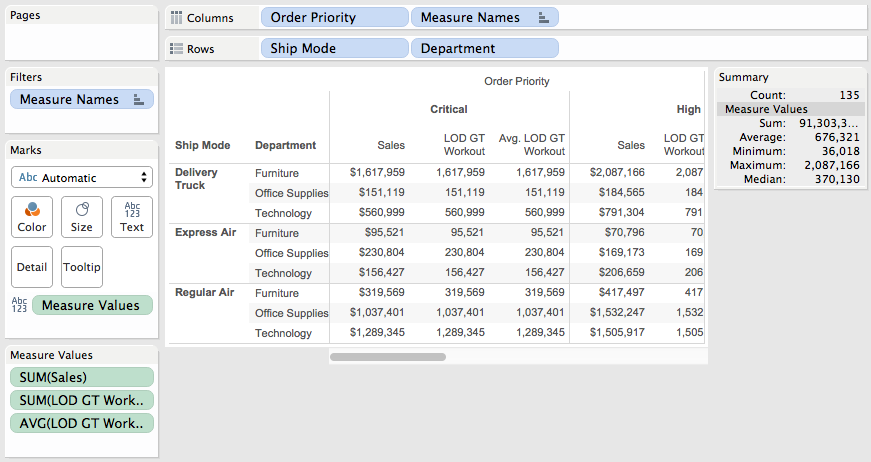
The table calculation solution uses the increased level of detail in the Grand Total technique covered in the second half of Customizing Grand Totals Part 2. By increasing the level of Detail in the Grand Total for each column (Order Priority) to effectively include the Ship Mode & Department, then we can get the original SUM(Sales) for each Order Priority, Ship Mode, & Department, then the table calculation can compute the average. We do this by first duplicating the Ship Mode & Department dimensions and adding them to the level of detail Shelf, here’s a view showing all the extra Marks in the Columns Grand Total:
Then the formula for the TC GT Sum Sales calculation is:
IF FIRST()==0 THEN WINDOW_AVG(SUM([Sales])) END
The Compute Using on this calc is an Advanced Compute using on the Ship Mode (copy) and Department (copy) dimensions and in the view the TC GT Sum Sales is simultaneously computed at 4 (!!) different levels of detail:
1) In the detail rows, the calculation addresses on the two copy dimensions, and partitions on the Order Priority, Ship Mode, & Department dimensions. Therefore each partition has only one address (mark), SUM(Sales) and WINDOW_AVG(SUM([Sales])) are effectively the same.
2) In the Row Grand Totals, the calculation addresses on the two copy dimensions and partitions on the Ship Mode & Department dimensions. The dimension on Columns (Order Priority) is not part of this computation because it’s the Row Grand Total. In the Row Grand Total the SUM(Sales) is now the sum across all Order Priorities for each Ship Mode & Department, and since the WINDOW_AVG() is partitioned on Ship Mode & Department the WINDOW_AVG() is effectively the same.
3) In the Column Grand Totals, the calculation addresses on the two copy dimensions and partitions on the Order Priority. The dimensions on Rows (Ship Mode & Department) are not part of this computation because it’s the Column Grand Total. Because of the two copy dimensions SUM(Sales) is the sum for each Order Priority, Ship Mode (copy) and Department (copy), then the WINDOW_AVG() partitions for each Order Priority. Since there are multiple Ship Modes & Departments for each Order Priority, the IF FIRST()==0… part of the calculation is necessary to have the calc return only one non-Null value for each Order Priority. Even with that, though, Tableau turns on mark stacking. Here’s a view that shows what is happening inside the Column Grand Total:
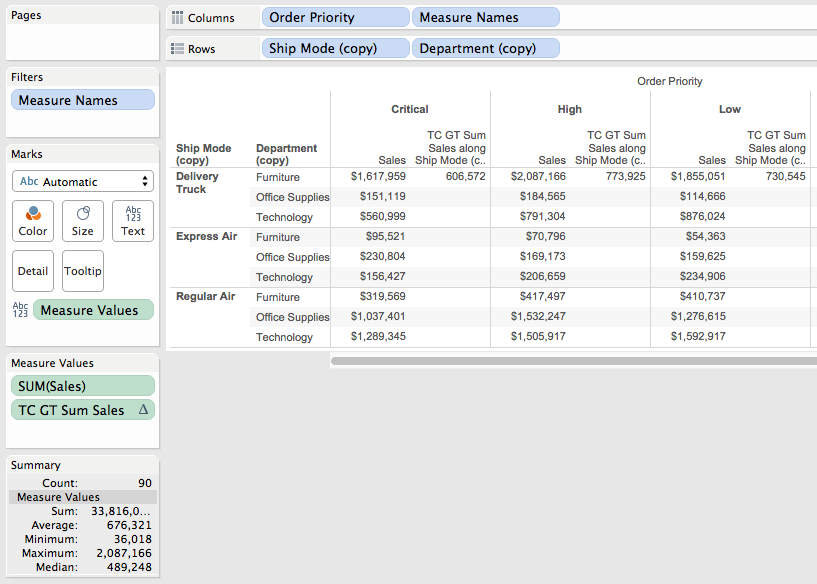
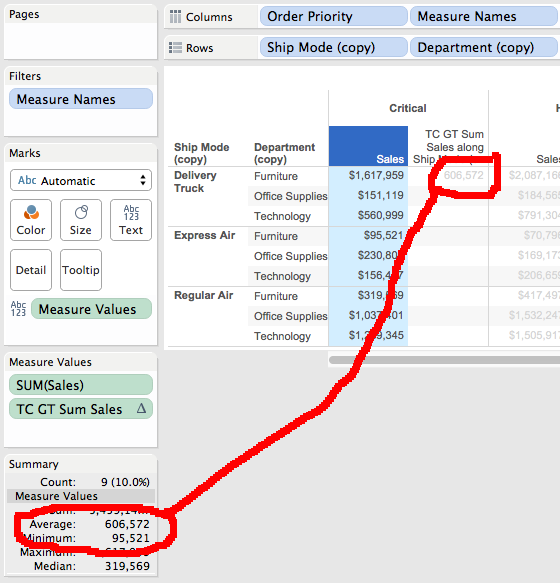
One way to validate that the TC GT Sum Sales calc is working accurately is to use the Summary card, in the following screenshot I’ve selected the Sales measure for the Critical Order Priority and the Average on the Summary card matches the average on the calc:
4) The corner Row & Column Grand total is the final computation, and in this one the calculation addresses on the two copy dimensions and that’s it. Because it’s in the Row Grand Total there’s no Order Priority i.e. no dimensions from Columns, and because it’s in the Column Grand Total there’s no Ship Mode nor Department i.e. no dimensions from Rows. The SUM(Sales) is the sum for each Ship Mode (copy) and Department (copy) i.e. summed across all Order Priorities, and then the WINDOW_AVG() applies to that.
To turn off the mark stacking for the final view we use Analysis->Stack Marks->Off (see The Stacking Snag for details). Here’s the view:
So that solution required duplicating & adding two dimensions to the view, using a table calculation with an Advanced Compute Using, as well as knowing to turn off a Tableau default. But that view doesn’t end there, because of the increased level of detail that can break other calculations, for example if I bring Profit into the view I see the SUM(Profit) but get overprinting in the Grand Total for Columns because of the increased level of detail there:
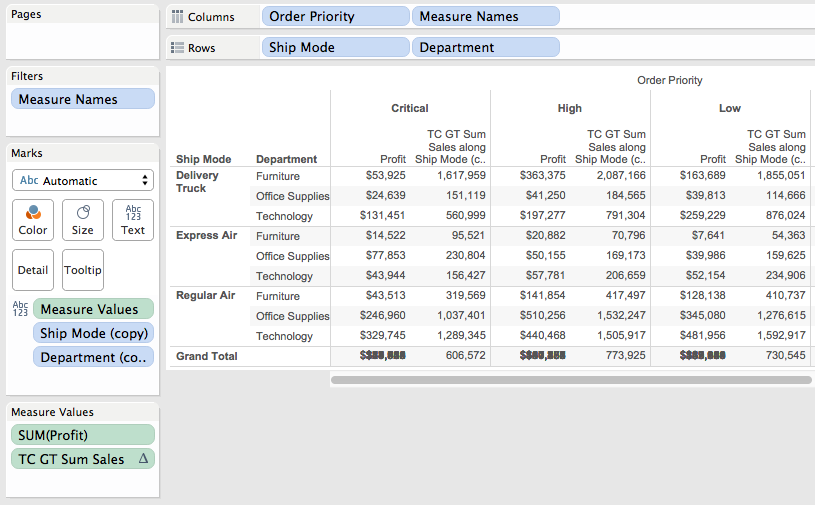
We’d need to build a similar calculation based on the Profit measure in order to get this to work. It’s possible, but requires a lot of attention. Read on for how Tableau v9 makes this easier.
LOD Expression Solution for Separate Custom Grand Totals for Rows and Columns
With LOD expressions we can avoid the need for adding the dimensions and complications of table calculations because of the two key properties of LOD expressions:
1) The LOD expression can be computed based on dimensions not at the current viz Level of Detail.
2) LOD expressions are aggregations returned as record level results that can be further aggregated, so we can get aggregates of aggregates such as the average of the sum of sales in a single calculation.
Using the process from my LOD Expression Remix post, here’s how to build the results using a single calculation:
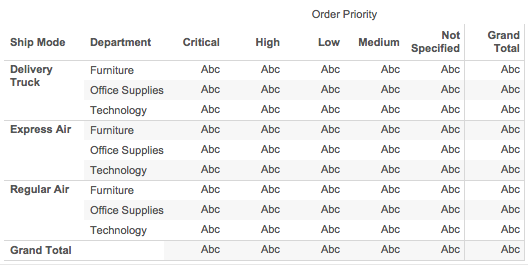
Starting out, here’s the final level of detail that we want to be working at:
We know that the LOD expression is going to need to work at several different granularities. The major case is that we need a calc that calculates the SUM(Sales) for each Department & Ship Mode. Here’s the Sum Sales per Dept & Ship Mode calc:
{INCLUDE [Department], [Ship Mode] : SUM([Sales])}
For the first workout view we create the view with the granularity that the LOD expressions will be working at and test out the LOD expression with different aggregations to verify that it is returning the same results. In the Grand Total for Columns (Order Priority) the calc has the level of detail of Order Priority, Department, and Ship Mode.
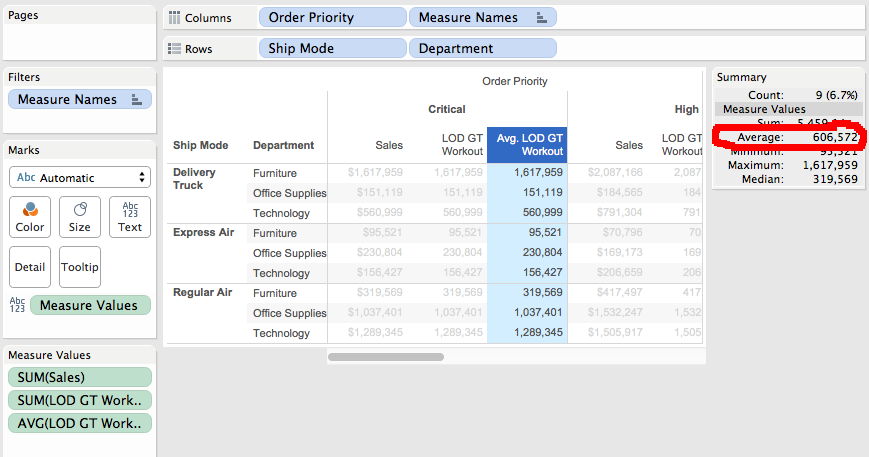
We can then display the Summary Card and select all the marks for a given Order Priority to get the overall Average that we want to use in the next step, the screenshot shows the value for Critical is 606,572:
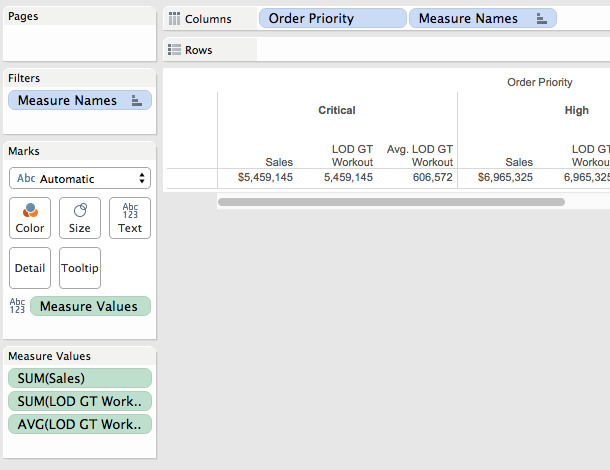
Another option for identifying the desired result is by using the same two-pass totals that we can’t use in the final view. In this view, I’ve set up SUM(Sales) as the measure and then turned on two-pass totals for the average:
And again we see 606,572 for the Critical Order Priority.
Now we go back to the vizLOD for the Grand Total on Columns which in this case is just the Order Priority and build a view for that:
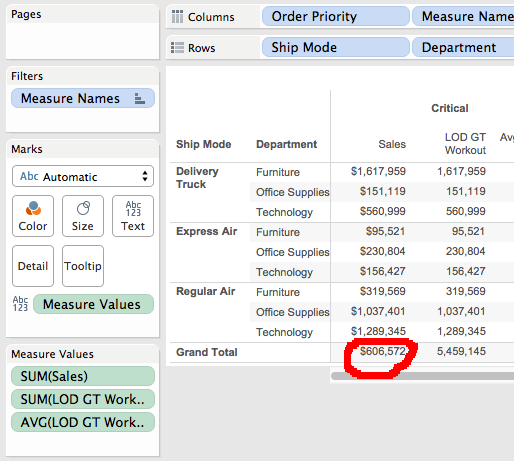
The SUM(Sum Sales per Dept & Ship Mode) is inaccurate because it’s summing the sum however the AVG(SUM Sales per Dept & Ship Mode) gets the aggregation that we want and the result of 606,572.
I’m skipping over testing the LOD expression in the other totals because we’re going to use the MIN()/MAX() technique from Customizing Grand Totals Part 2 to only return the LOD expression to the Grand Total on Columns and return SUM(Sales) that we already know works for everything else. Here’s the formula for LOD GT Sum Sales:
IF MIN([Department]) != MAX([Department]) THEN
AVG({INCLUDE [Department], [Ship Mode] : SUM([Sales])})
ELSE
SUM([Sales])
END
~~~test whether we need the rest of the calc at all
The IF statement only evaluates to True inside the Grand Total on Columns, everywhere else there is a Department dimension active – see the Table Calculation section above for the level of detail inside the detail rows and the 3 grand total sections. So for that Grand Total on columns the LOD expression is computed, otherwise the simple SUM(Sales) is returned.
Here’s the view:
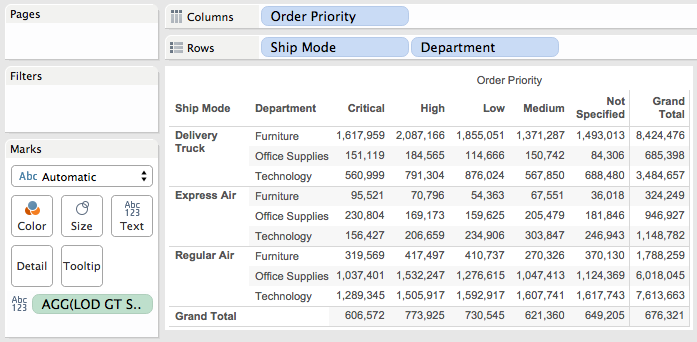
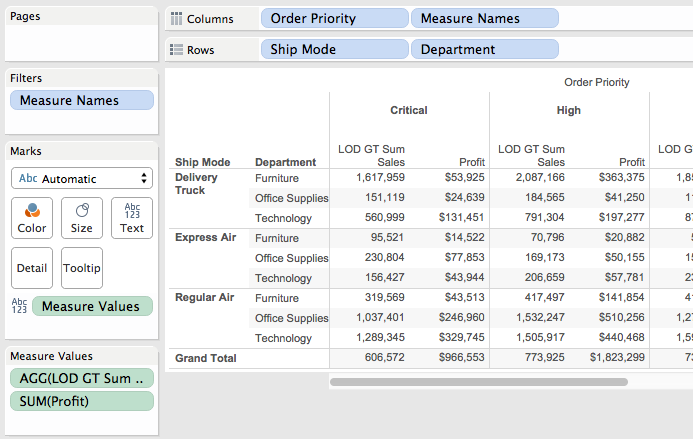
So there’s no need to increase the level of detail of the view with duplicated dimensions, use a table calculation with an Advanced Compute Using, turn off mark stacking, or deal with other complications. And if I bring SUM([Profit]) into the view then it immediately works without the overprinting of the Grand Total solution, with Profit being summed as usual on both the Column and Row Grand Totals:
Conclusion
It’s possible to get different custom grand totals for the same measure via different methods, and there are a number of cases where LOD expressions can enable us to get customized grand totals with much less effort than table calculations. The major “trick” here is to pay attention to each level of detail that each mark is using, whether in the detail rows or one of the grand totals, and appropriately test for that.
Here are Tableau Public links for the two workbooks used to build this post:
if I bring Profit into the view I see the SUM(Profit) but get overprinting in the Grand Total for Columns because of the increased level of detail there
Hi, you’ll need to use either a table calculation like IF FIRST()=0 THEN SUM([Profit]) END or potentially remove the pill(s) from detail and use an LOD expression to include them in the calculation. Without seeing your view I can’t say what would work for you.