The Letdown
Tableau does amazing demos. Fire up the software, connect to a data source, select a couple pills, click Show Me, boom there’s a view. Do a little drag and drop, boom, another view. Duplicate that one, boom, another view to rearrange. Within three minutes or less you can have a usable dashboard, for 200 rows of data or 200 million.
 If you’ve seen those demos, the not-so-dirty little secret of Tableau is that they pretty much all start with clean, well-formatted, analytics-ready data sources. As time goes on, I’ve interacted with more and more new Tableau users who are all fired up by what they saw in the demos, and then let down when they can’t immediately do that with their own data. They’ve got to reshape the data, learn some table calcs right away, or figure out data blending to deal with differing levels of granularity, and/or put together their first ever SQL query to do a UNION or a cross product, etc. Shawn Wallwork put it this way in a forum thread back in January: “On the one hand Tableau is an incredibly easy tool to use, allowing the non-technical, non-programmers, non-analysis to explore their data and gain useful insights. Then these same people want to do something ‘simple’ like a sort, and bang they hit the Table Calculation brick wall…”
I work with nurses and doctors who are smart, highly competent people who daily make life or death decisions. Give them a page of data and they all know how to draw bar charts, line charts, and scatterplots with that data. They can compute means and medians, and with a little help get to standard deviations and more. But hand them a file of messy data and they are screwed, they end up doing a lot of copy & paste, or even printing out the file to manually type the data in a more usable format. The spreadsheet software they are used to (hello, Excel) lets them down…
…and so does Tableau.
A data analyst like myself can salivate over the prospect of getting access to our call center data and swooping and diving through hundreds of thousands of call records looking for patterns. However, the call center manager might just want to know if the outgoing reminder calls are leading to fewer missed appointments. In other words, the call center manager has a job to do, that leads to a question she wants to answer, and she doesn’t necessarily care about the tool, the process, or the need to tack on a few characters as a prefix to the medical record number to make it correspond to what comes out of the electronic medical record system; she just wants an answer to her question so she can do her job better. To the degree that the software doesn’t support her needs, there has to be something else to help her get her job done.
The Pivot
When Joe Mako and I first talked about writing a book together, our vision was to write “the book” on table calculations and advanced use cases for Tableau. We wanted (and still want) to teach people *how* to build the crazy-awesome visualizations that we’ve put together, and how they can come up with their own solutions to the seemingly-intractable and impossible problems that get posted on the Tableau forums and elsewhere. And we’ve come to realize that there is a core set of understandings about data and how Tableau approaches data that are not explicitly revealed in the software nor well-covered in existing educational materials. Here are a few examples:
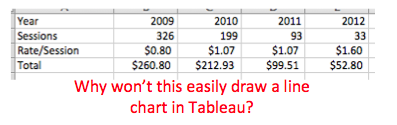
- Spreadsheets can have a table of data, so do databases (we’ll leave JSON and XML data sources out of the mix for the moment). But spreadsheet tables and database tables are very different: Spreadsheet tables are very often formatted for readability by humans with merged cells and extra layers of headers that don’t make sense to computers. A single column in a spreadsheet can have many different data types and cells with many meanings, whereas databases are more rigid in their approach. We tend to assume that new users know this, and then they get confused when their data has a bunch of Null values because the Microsoft Jet driver assumed the column starting with numbers was numeric, and wiped out the text values.
 We—Tableau users who train and help other users—talk about how a certain data sets are “wide” vs. “tall”, and that tall data is (usually) better for Tableau, but we don’t really talk about what are the specific characteristics of the data and principles involved that in a way that new Tableau users who are non-data analysts can understand and apply those principles themselves to arrange their data for best use in Tableau.
- Working with Tableau, we don’t just need to know the grain of the data–what makes a unique row in the data–we also need to understand the grain of the view–the distinct combinations of values of the dimensions in the view. There can be additional grains involved when we start including features like data blending and top filters. Even “simple” aggregations get confusing when we don’t understand the data or Tableau well enough to make sense of how adding a dimension to the view can change the granularity.
 Just as we can’t expect to be a brilliant painter without an understanding of the interplay between color and light, we can’t expect to be a master of Tableau without a data- and Tableau- specific set of understandings. Therefore, we’ve been pivoting our writing to have more focus on these foundational elements. When they are in place, then doing something like a self-blend to get an unfiltered data source for a Filter Action becomes conceivable and implementable.
 This kind of writing takes time to research, think about, synthesize, and explain. I’ve been reading a lot of books, trawling through painfully difficult data sets, filling up pages with throw-away notes & diagrams, and always trying to keep in mind the nurses and doctors I work with, the long-time Tableau users who tell me that they still “don’t get” calculated fields in Tableau (never mind table calcs), and the folks I’m helping out on the Tableau forums. So “the book” is going slower than I’d hoped, and hopefully will be the better for it.
If you’d like a taste of this approach, I’ll be leading a hands-on workshop on pill types and granularity at this month’s Boston Tableau User Group on April 29.
Postscript #1: I’m not the only person thinking about this. Kristi Morton, Magdalena Balazinska, Dan Grossman (of the University of Washington), and Jock Mackinlay (of Tableau) have published a new paper Support the Data Enthusiast: Challenges for Next-Generation Data-Analysis Systems. I’m looking forward to what might come out of their research.
Postscript #2: This post wouldn’t have been possible without the help (whether they knew it or note) of lots of other smart people, including: Dan Murray, Shawn Wallwork, Robin Kennedy, Chris Gerrard, Jon Boeckenstedt, Gregory Lewandoski, and Noah Salvaterra. As I was writing this post, I read this quote from a Tableau user at the Bergen Record via Jewel Loree & Dustin Smith on Twitter: “Data is humbling, the more I learn, the less I know.” That’s been true for me as well!
I’m with you on every point here Jonathan, wonderful work!
Having been the recipient of your kind and generous assistance on the Tableau forums, I am eagerly looking forward to your book. The one thing I’ve noticed with the Tableau books to date is that they tend to just re-hash the same examples from the classes, and are really oriented towards new users and clean data. Using Tableau-provided data does give you the impression that Tableau is super-powerful. But, as you point out, you quickly hit the brick wall of poor data quality and formatting issues and all the minutia of having to do the pre-processing work before you can even do the Tableau work, and then soon hit the brick wall of table calcs/window calcs/custom calcs. It would be awesome to have a sense of what pre-processing work needs to be done to get stuff into Tableau for maximum usability. Here is where Tableau falls flat, and I blame the Tableau team for this. They are great at providing a space for user-led support and help, which on the one hand demonstrates their passionate user base, but on the other hand points to the total lack of support and assistance for users looking to get past beginner stages. I often ask other Tableau users “do you know table calcs and window calcs?”, to which they often say “of course!” But then I start asking the “how do you do…” or “can you help me with…” and they are stumped. They too often assume that knowing how to do simple calculated fields automatically means they “know” all the details but with Tableau it is so often not the case. I equate it to all the people who think they “know” excel because they can do pivot tables and VLOOKUPs.
I like Tableau the tool and I’d love to use it more than I do, but the lack of confidence I have in how I construct more advanced vizes leads me to having to redo work in both Excel and Tableau so I can cross-check. And if I’m going to do that, I might as well keep it in Excel. I’ve been desperately looking for a book that will help me make that tough climb from basic Tableau to even mid-level Tableau. I am hopeful that your book will help me hit that next level.
Sooo true. Most recently, we invested a good deal of money to have our data re-shaped so that Tableau could handle it better, only to find that Tableau Online can’t use the data. Grrr.
Just read Jay’s comments and want to say “here, here!” I was working with Tableau for about 2 years and it wasn’t until the Kraken reveal workshop that I discovered something about “big data” Tableau users…they’re ALL using some process/software in between their data and Tableau. Big a-ha for me. I’ve submitted an idea in the forums that Tableau conduct a customer survey to find out WHAT people are using and perhaps how they would rate the effectiveness. Then new users who make the same discovery I did might have a clue as to what intermediary software / process they should pursue.
Jonathan, thank you so much for this post. It mirrors my experience as I work with Tableau customers every day. The software is incredible: the simplicity of use, the discoveries that can be made. But there is a brick wall – I see people encounter it all the time. And there is a pivot – a way of thinking where you really understand what Tableau is doing and why. And it knocks down the walls (most of them). I look forward to your (and Joe’s) book like I’ve never looked forward to any other Tableau book. Being able to articulate and teach this way of thinking will be a great service. Thanks again!
I certainly don’t expect to learn the tool without some practice and work; the problem for me is that it is difficult to understand what is happening behind the scenes and why, particularly if you’re not experienced with database concepts. I don’t blame anyone for this – it is what it is.
I, too, cannot wait for the book. Thanks for posting, and thanks for all you do in this realm.
Thank you for this post. Extremely validating in terms of my experiences with Tableau. I’m taking the Advanced Tableau Training course this week and had hoped that datasets and table calculations would be explored in greater depth, but this was sadly lacking from the curriculum. I’ve shared the link to this post in my student feedback form. 🙂
Thanks for posting this, Jonathan. As much as I love Tableau, and that’s a lot, it continues to amaze me that many of the things that could be done to expand the horizon of things it makes easy to do, not just possible, aren’t incorporated into the product.
Joe and you, first among all of us, have led the way in exploring -how- Tableau works and explaining it with grace and patience so that the rest of us can learn and in time use this knowledge to our advantage. And that’s a very good thing. I for one am in your debt, and I’m constantly amazed how many impressively clever hacks the community comes up based upon these foundations. But they’re hacks, and impenetrable to the uninitiated.
I try to remain hopeful that Tableau the company will pivot (steal) and concentrate on expanding the realms of ease of use and ranges of applicability, from the small irksome bits to the structural things like recognizing different data organizations and providing a facility for incorporating logic -as- logic, not just as artificially structured data. So far if feels like they’ve been moving forward so fast that fixing things that aren’t technically bugs don’t get attended to.
Thanks again for everything.
Excellent post. It amazes me that a product with a stock symbol of DATA is so poor working with “real-world” data.
Thank You! As a novice trying to navigate Tableau with the aid of forums, blogs, ebooks and a lot of hours spent seemingly in vain, thank you for making me realize I may not be losing my mind. I look forward to the book and, more material that realizes that a legion of neophytes, like me, are coming. And, as Tom pointed out, this publicly traded company needs us to continue its growth.