Embarrassment is the feeling of getting caught doing exactly what you wanted to be doing.
– Author unknown
Today I get to celebrate a new Tableau 8.1 feature and reveal some obsessive compulsive behavior. My first big set of posts on this blog were about answering a really common forums question, how to customize grand totals. With Tableau 8.1’s new Two Pass Totals feature, you just might not need those posts anymore!
The new two pass totals let us have a custom aggregation of Sum, Avg, Min, or Max over an aggregation, or keep the current “Automatic” behavior. Here’s a quick example with a simple worksheet from Superstore Sales:

In the Grand Total, the sum of sales is computed across all of the data. If we want the Grand Total to be the average of the sum of sales for each department, we can get via two different ways in a couple of mouse clicks:
- From the Analysis->Totals->Total All Using->Average menu (this sets the aggregation for all measures in the view):

- Or from the SUM(Sales) pill itself, by right-clicking on the pill and using the context menu:
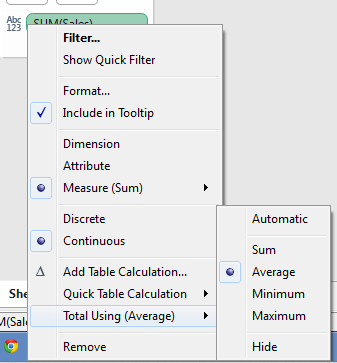
Either way, we end up with the desired average of the sum of sales for each department:
In addition, there’s an extra option for all grand totals, to hide them. This is great for a measure like a % of total or something that might not make sense to have a total of: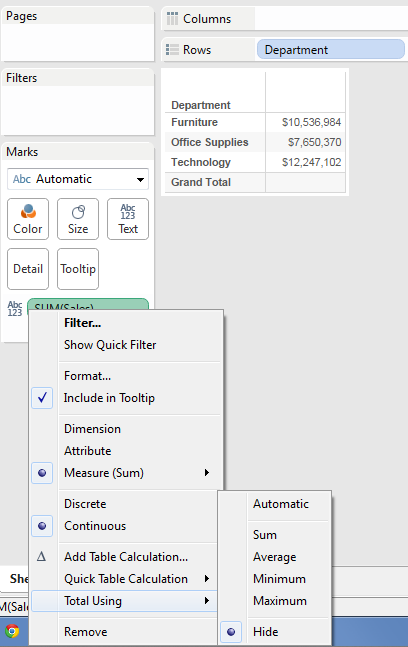
What Types of Measures are Supported by Two Pass Totals in v8.1
For the Tableau 8.1 release, only certain types of measures are supported for two-pass totals:
- regular aggregates like SUM([Sales]) from primary and secondary data sources
- computed aggregates like SUM([Profit])/SUM([Sales]) from primary or secondary data sources
What is not supported in v8.1 for custom two-pass grand totals are the following:
- computed aggregates that include fields from blended data sources such as SUM([secondary data data source].[Sales])
- table calculations from any source
For those unsupported measures, when we try to use a custom grand total we see some greyed-out options, all we can do use use the current behavior or Hide the grand total:
If you’d like to have those options available in a future release, please vote up http://community.tableausoftware.com/ideas/1232. In the meantime, you can still use the techniques from the custom grand totals post I linked to earlier.
When an Aggregate is an Aggregate
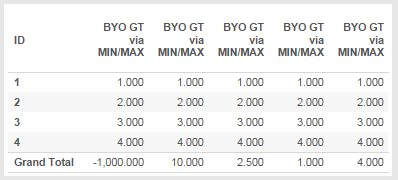
One interesting wrinkle where the custom calculations and two pass totals have an interesting reaction is when using the MIN/MAX technique from Customizing Grand Totals Part 2 with a regular aggregate calc. For that calc, Tableau can compute the two pass totals for Sum, Avg, Min, and Max custom grand totals and thereby override the custom aggregation. Here’s an example, from left to right the Grand Total aggregations are Automatic (which returns the custom grand total of -1000), Sum, Avg, Min, and Max:
OCUCD – Obsessive Compulsive Use Case Design (or Disorder)
During the Tableau 8.1 beta process I tested this out on most every use case I could think of – there are 44 of them. Here’s the workbook I used during the beta on Tableau Public:
If you come up with other use cases, or find other interesting uses of this new functionality, please share them!
Pingback: Customizing Grand Totals – Part 1 | Drawing with Numbers
Pingback: Customizing Grand Totals – Part 2 | Drawing with Numbers
Pingback: Customizing Grand Totals – Part 3 | Drawing with Numbers
Great article as usual !
Is there a way we can do the following ?
1. Get all category values to display (assume there are four regions) but compute the Grand Total only on the basis of Three Regions
2. I have a defined organizational structure. I am showing the reps under a specific manager and the “Grand Total” of those reps in a specific region. If I wanted that group to be compared against another similar group, how do I do that ?
Thanks! Not having details of your data, and view, I can’t give you exact answers, I can give you some tips, though:
1. Use the min/max technique from http://drawingwithnumbers.artisart.org/customizing-grand-totals-part-2/ and in the grand total computation part, do a row level calculation that excludes the desired Region, like SUM(IF [Region] != “West” THEN [Sales] END). If your measure is based on table calcs, then I’d probably need to see a packaged workbook with some sample data, you could post it at the Tableau Community Forums and then link back to it here.
2. I’m not sure what group you want to compare. Are you looking to compare one manager’s performance to another, one region’s performance to another? In any case, in general there are a few ways to do these comparisons in Tableau:
– Use a subquery, database view, etc. to return the comparison data as part of your data source
– Use a self-blend at the right level of detail to return the comparison data.
– Use table calculations to set up the comparison.
If you need more help, posting a packaged workbook would be best.
Good luck!
Tons of great information on your site. Thank you.
Any workarounds for arriving at the correct grand total when using blended data from secondary sources?
My row level totals are correct for:
Combined Field = sum(primary source – calculated field) + sum(secondary source – calculated field)
But for the life of me, I can’t figure out how to get the column grand total for this combined field to add up correctly based on what is displayed.
——————-
“What is not supported in v8.1 for custom two-pass grand totals are the following:
computed aggregates that include fields from blended data sources such as SUM([secondary data data source].[Sales])”
Since the two-pass totals won’t currently get you what you need, what you can do is use a custom grand total as outlined in the series starting with Customizing Grand Totals – Part 1.
I have a similar issue as Ram and I’m running on version 8.2.4.
I have 7 calculated fields that are each derived via this method:
[Calc Field_master database]*([Calc field_from Stored Procedure]*([Calc Field_from third db]-[Calc Field_master db])
I then sum these 7 calc fields into a Total field. Then drop this Total field into my Measure Values.
The problem is that I can get the correct amounts to appear when I add a dimension (from the Master db) filter to the Row shelf (which stands for TradeID), but when I drop the TradeID from the filter shelf it turns what should sum to -5,600 into -2,000,000.
I tried adding the Trade ID to the detail (in Marks section), with no success. I tried using the Fake Header trick outlined in ‘Customizing Grand Totals – Pt 1’ with no success.
Please help! This is delaying my project deadline…
Hi Diego,
I apologize for the delay, I just got this notification. Are you still looking for help with this?
COUNT([Resource WWID])/COUNT([ONBOARD(Feb Headcount Data)].[Resource WWID])*12/MONTH([Attrition Freeze Date])
Hi I Have written above formula which is calculating count of resource wwid id from onboard datasource. this formula is for computing the percentage. now the problem is when i am showing grandtotal in the cross tab . it is taking values for the selected measures only in the view whereas i want total value from that datasource. can you please tell me how can i achieve this
Without knowing a lot more details I can’t give you an answer, please post a packaged workbook with some sample data to the Tableau forums at http://community.tableau.com then link back to it here and I’ll take a look.
Hi Jonathaon i have shared the workbook . Please help me in getting the solution . The link is given below
http://community.tableau.com/docs/DOC-6112
sorry this is the link
http://community.tableau.com/thread/159902?start=15&tstart=0
Hi jonathon , can you have a look at that. I am facing this issue for quite a long time
Thanks for this post. Is there a way in Tableau to have average for some columns and sum for others… Example if I had Sales $I would want the same and if I had sales percentage on another column and wanted to find out average sales percentage distribution ?
Thanks,
If the calcs are all regular aggregates from a single data source (primary or a secondary), then you can use the two-pass totals to generate an average. However, if the calcs are table calcs or blended calcs that depend on results from multiple data sources then you’d have to build a custom grand total.
Question: I have two spreadsheets from the same file (join) and each one creates sets of measures and dimensions. However, when I create a calculated measure, the measure calculation is wrong. I no the calculated measure needs to go under one of the sets of measures, but I cannot get that to work. Is there an option for me to move a calculated field under a specific set of measures or dimensions?
Are you talking about the Measures and Dimensions lists in the Data window? Or are you talking about the Rows and Columns Shelves? In the former case, the Dimensions header has options to change the grouping to by folder rather than by data source. In the latter case, it’s probably a situation where you’ve got blue (discrete) pills and green (continuous pills) and are wanting a different arrangement than Tableau supports. See http://www.theinformationlab.co.uk/2011/09/23/blue-things-and-green-things/ for more info on that.
Hi Jonathan,
I am trying to have the Grand total column display the window avg. (LTM) of the calculated fields in each row. I see where you have posted some work arounds in the tableau forum but i’m still having trouble determining if it is applicable to me or if the functionality just isn’t there for the fields i’m using or the set up of my table. Any suggestions or advice?
Hi Kelsie, sorry for the late reply… if you don’t have the two-pass totals option available then it’s likely that your calculation is using ATTR(), a blended calc, or table calculation that is not presently supported. If you haven’t been able to resolve this then I’d suggest you post to the Tableau forums with a packaged workbook and sample data showing your problem and then post here as well and I’ll take a look!