Tag Archives: Excel

Conditional Formatting

Conditional Formatting Equivalents

The most complete post on conditional formatting in Tableau is this one: http://drawingwithnumbers.artisart.org/older-but-still-useful-conditional-formatting/, which describes the multiple axis crosstab here: http://public.tableausoftware.com/views/conditionalformattingv4/Introduction. Other than the Formatting Numbers section, most everything else is covered in that post & workbook.

Building a Measure Names/Values Table – Have only One Measure on Measure Values Card

Put Measure Names on the Filters Shelf first and keep only the desired Measured Value(s), possible to have just one Measure Value this way and still have a header. http://community.tableausoftware.com/message/214871#214871
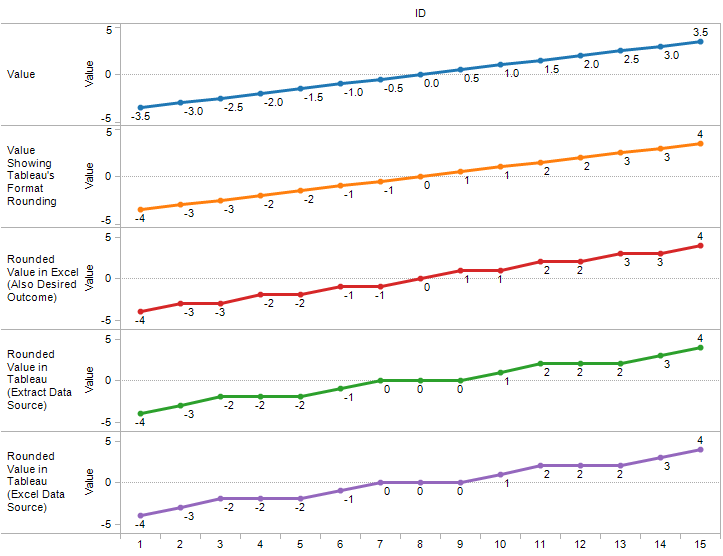
Formatting Numbers

http://www.clearlyandsimply.com/clearly_and_simply/2011/04/tableau-quick-tip-2-custom-number-formats.html#more

http://community.tableausoftware.com/thread/118621

Creating custom color palettes
http://kb.tableausoftware.com/articles/knowledgebase/creating-custom-color-palettes

highlighting specific rows: Rapid Graphs by Stephen McDaniel and Eileen McDaniel, http://www.freakalytics.com

aligning shapes for marks: mark_align.twbx file by Joe Mako in http://community.tableausoftware.com/thread/113351

setting up custom highlight table: margin_zone.twbx file by Joe Mako in http://community.tableausoftware.com/thread/110007

http://www.tableausoftware.com/support/forum/topic/conditional-formatting-columns-cross-tabs-conditional-appearance-marks-0
http://www.tableausoftware.com/support/forum/topic/conditional-formatting
http://www.tableausoftware.com/support/forum/topic/conditional-background-formatting
http://www.tableausoftware.com/support/forum/topic/conditional-formatting-columns-cross-tabs-conditional-appearance-marks
http://www.tableausoftware.com/support/forum/topic/conditional-formating-measures
http://www.tableausoftware.com/support/forum/topic/how-can-i-do-these-things
http://www.tableausoftware.com/support/forum/topic/shape-alignment#comment-39152

Make an “empty” header:
http://www.tableausoftware.com/support/forum/topic/output-particular-format-column#comment-43090

Force Tableau to show text headers in a row and not hide them in cross-tab display:
http://community.tableausoftware.com/message/172574#172574

Removing last column (Abc column)

http://community.tableausoftware.com/message/174253#174253
http://kb.tableausoftware.com/articles/knowledgebase/removing-abc-placeholders

Crosstabs and Text Tables

Putting more columns than the default 6 on tables – from the menu bar, select Table->Options and increase the number of columns

[loop category=”wikicontent” tag=”conditional-formatting,formatting,Excel,format”]
[field title] – Added [field date]
[content]
[/loop]

Related posts:

    [loop tag=”conditional-formatting,formatting,Excel,format” exclude=”this” relation=”and” compare=”not” taxonomy=”category” value=”wikicontent”]

  • [field title-link][field thumbnail-link]

[/loop]

Preparing Data

Key bits on migrating from Excel

http://kb.tableausoftware.com/articles/knowledgebase/preparing-excel-files-analysis
http://kb.tableausoftware.com/articles/knowledgebase/addin-reshaping-data-excel

anonymizing data for Tableau

http://community.tableausoftware.com/thread/118843

DATE() and STR() functions behave differently depending on the data source (Excel/text/Access vs. extract)

http://community.tableausoftware.com/message/179624

DATEPARSE() for converting different date formats

DATEPARSE-ing Tips for Successful Speed Dating with Tableau 8.1


Joining Vs. Blending

http://www.tableausoftware.com/support/knowledge-base/join-vs-relationship-60
http://www.tableausoftware.com/support/knowledge-base/summary-and-detail-60

When one data source has subcategory & measures, and another has category & subcategory, can use Primary Groups to effectively create the category within the first data source. KB has article on this, search for “creating primary groups from a secondary source”.

Data blending and getting aggregations right:

Workbook with three options (extract, control data relationships for blend, custom SQL) by Jeff Mills:
http://community.tableausoftware.com/message/183888#183888
http://community.tableausoftware.com/thread/118319

Creating a Tableau Data Source .tds for connecting to just the database and not the table by Craig Bloodworth:
http://www.theinformationlab.co.uk/2012/11/26/connect-to-a-database-without-specifying-a-table-video/

Outer joining multiple Excel tables
https://www.interworks.com/blogs/tmccullough/2013/06/26/outer-joining-multiple-excel-tables-tableau-8

Custom datasource config files:
http://community.tableausoftware.com/message/227764

[loop category=”wikicontent” tag=”preparing,reshaping”]
[field title] – Added [field date]
[content]
[/loop]

Related posts:

    [loop tag=”preparing,reshaping,anonymizing,blinding,reshape,reshaper” exclude=”this” relation=”and” compare=”not” taxonomy=”category” value=”wikicontent”]

  • [field title-link][field thumbnail-link]

[/loop]

Stacked Bars and Lines

Bars and Lines

This is a post about getting the output you want, despite what Tableau thinks.
This is a post about making Tableau do what Excel can do (whether it’s a good idea or not).
This is a post about gaining better understanding of dimensions, measures, continuous, and discrete.
This is a post about putting bars and lines on the same chart. Continue reading

Older But Still Useful – Conditional Formatting

Back in May of this year before I started this blog, I did a presentation at the Boston Tableau User Group on conditional formatting in Tableau. Prior to using Tableau, I’d created some dashboards and reports in Excel, and when I tried to re-create them in Tableau I ran into a number of different issues in terms of doing the kinds of formatting, layout, and conditional formatting that are possible in Excel. I created a workbook with every technique I could find and some I figured out. Continue reading

Unexpected Results: Rounding

When using Tableau with different data sources, it becomes obvious fairly quickly that there are differences in what functions are available in one data source vs. another. For example, MEDIAN() and COUNTD() are functions not available in MS Excel, Access, or text data sources, but are available in Tableau Data Extracts and many others. This post goes into a case where the same function is available, but is returning different results than we might expect depending on context, and introduces a workaround. Continue reading