Here’s a sample data set with 4 records:

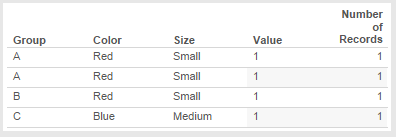
When we bring that data set into Tableau and build a text table, though, we only see 3 rows:

If we want to show all 4 underlying records as 4 rows in the Tableau text table we have to jump through a couple of hoops, the rest of this post describes why Tableau behaves that way and how to fix it.
![]()
The Data is Too Tall
There are all sorts of resources about working with data that is “too wide”, for example the old Preparing Excel Files for Analysis KB article, the new Pivot feature introduced in Tableau v9.0, or this post on Tiny Habits from Emily Kund with commentary from yours truly. Too wide data has too many columns for the kind of analysis that we want to use. There aren’t so many resources on “too tall” data, of which this is an excellent example.
To explain what “too tall” data is, let’s first look at the data:
What is the grain of this data? In other words, what combination of field(s) makes a unique record in the data? We might be tempted to say Group, Color, and Size, but for Tableau there is no difference between the first two records:

Effectively the data has no unique grain. Yes, there’s a difference in position between these two records but that is not detectable by Tableau because record order (position) is not something stored in each record. This highlights something I talk about in my training classes: the difference in mental models between Tableau and WYSIWYG tools like Excel. Tableau approaches data as a database does, and the default behavior in databases is that record order doesn’t matter. The reason databases abstract record order away is to get higher performance.
So when we bring this data into Tableau and create a view Tableau’s default behavior is to aggregate the data to the level of the dimensions in the view (i.e. on all Shelves and the Marks Card except for Filters). Here’s what happens we bring all the fields in this data set into the view as dimensions:
There aren’t enough dimensions to separate out the two A/Red/Small records. This explains what I wrote earlier about the data lacking enough dimensionality. What we really need is another column (field) to identify the records. So we now have a simple definition:
- “too tall” data has too few columns to effectively perform the analyses we want
- “too wide” data has too many columns to do effectively perform the analysis we want
The rest of this post describes three ways to show all the records: Show Underlying data, editing the source, and constructing a specific Tableau view.
Do You Need to Show the Data in a View?
If you don’t need to show the data in a Tableau view users can still view the underlying data in both Tableau Desktop and from Tableau Server & Online. Here’s the underlying data in Tableau Desktop:

And on Tableau Server:
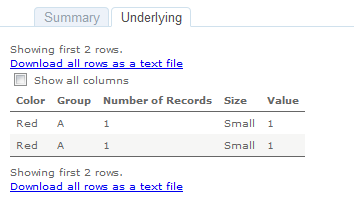
So some user education might be all you need to show all the records. If the data is too tall and you do have to show a view with all the records then you can alter the source data or set it up in Tableau.
Do You Control the SpiceSource?
If you have control over the source data then many sources have features to add a unique record identifier that would add that necessary column to make the data not too tall, not too wide, but just right. For example Excel has the ROW() function:
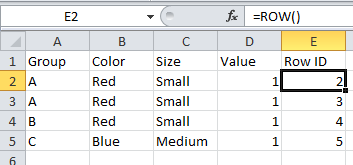
Creating a view with this that shows every record is trivial, we just need to add Row ID as a dimension:
If you’re not using Excel then you’ll need to look for a function that adds a row ID, record ID, etc. Part of why this is a rare problem is that most relational data tables are set up with unique keys (indexes) that give us those unique values to draw tables. Where I typically see too tall data coming from is from hand-entered data sources and ancient systems.
When you don’t have that option and you’re stuck with too tall data we can still get a view showing every record in Tableau.
Building a Tableau View Showing Every Record for Too Tall Data
There are three main steps to building a view to show every record:
- Turning off aggregation so Tableau will return every record from the data source.
- Creating a table calculation to increment over each record and provide a unique identifier.
- Using that table calculation as a discrete pill to sort the view.
Here’s how using the above data source:
- Turn off Analysis->Aggregate Measures:

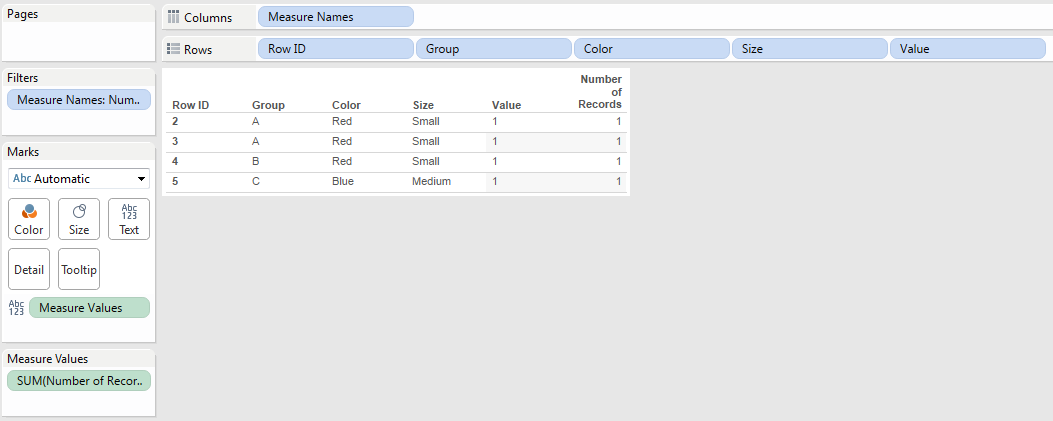
The view now looks like this:

The reason why there’s a lot of white space is that Tableau is now returning multiple records (the two 1’s) for A/Red/Small and has turned on Mark Stacking by default. This is not a problem, we’ll be rearranging the view later on to get rid of Mark Stacking. - Create a Rank calculated field with the following formula:
RANK_UNIQUE(MIN([Number of Records]))I use RANK_UNIQUE() here instead of INDEX() because rank only counts non-Null values and should there be any unwanted densification those ranks will return Null, whereas INDEX() would return values that would throw off the desired ordering.
- Drag the Rank field to the Level of Detail Shelf and set the Compute Using to an Advanced… Compute Using where all the dimensions are used for addressing in the order that you want the records to appear:

Something I’ll typically do at this point to validate is to add the table calc (Rank) to the text Shelf or Measure Values (here I have it on text):
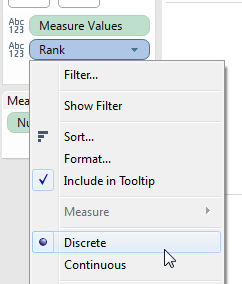
And we can see that the Rank is accurate. - Turn Rank into a discrete (blue) pill:
- Drag Rank to the Rows Shelf to the left of all the dimensions. With the unique identifier for each record (mark) the Mark Stacking goes away:

- As the last step turn off Show Headers for the Rank pill:

The view now shows each individual record:
Conclusion
Tableau is designed to help us dive & swoop through thousands/millions/billions of rows of data to discover insights so Tableau’s default behavior is to aggregate the data. Tack on Tableau’s mental model of treating data as a database does and a task like showing every record can be more complicated when the data source isn’t aware of more modern database concepts and lacks the necessary dimensions to uniquely identify each record. A feature request for row numbering has been created to make this easier, vote it up if this is something that interests you!
Here’s a link to the too tall workbook on Tableau Public.
Hello,John, Those are some impressive tricks. I had been trying to find out how to make automated pdf reports in Tableau. Would be glad, if you can write an article on that! Would really appreciate your time! Thanks for doing this!
Hi Jaswanth,
Thanks! I’m actually working on a post about emailing from Tableau…to automate PDF reports you have basically three options:
1) Create your own scripts using tabcmd or trusted tickets to download from URLs, if you do a web search for tableau email PDF you’ll find some ideas.
2) Use a commercial tool such as Metric Insights.
3) (saving the best for last) I’ve contributed code to VizAlerts, an open source tool for threshold-based alerting and batch distribution from Tableau. It’s a set of Python scripts that extend Tableau’s subscription functionality to support PDF, PNG, and CSV output, including merging PDFs from multiple workbooks/dashboards into a single PDF. You can download it at http://github.com/tableauVizAlerts, there’s a fairly comprehensive user guide that covers a number of use cases.
There’s a branch of the code that I built that hasn’t been integrated yet that has support for file export and uses the Twilio messaging service for SMS.
Jonathan