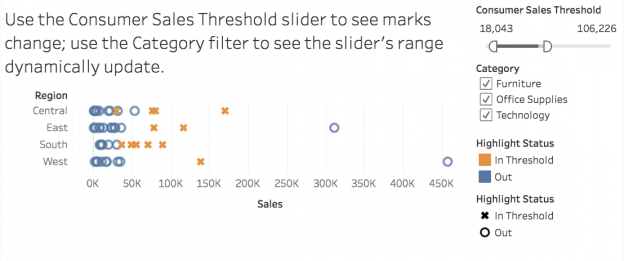
Tableau’s native parameters have a couple of key limitations as of this writing in February 2018: The list of values is static and we can only select one value at a time, not a range of values. So when we want to do something like set up a viz with user-selectable top and bottom thresholds we have to set two parameters, not one, when what we really want is a nice range control like the view below:
What it looks like here is that I’m using a ranged “parameter” to change the mark color & shape whose set of possible values is based on other filters…which is what we’ve wanted in Tableau for awhile now. Now you might be asking “Why go to all this trouble, why not use Tableau’s JavaScript API or the (forthcoming) Extensions API?”. And my response to that is that not everyone has the expertise available to use Tableau’s APIs or D3 so we’ve got to make the best use of the tool that we have at hand. Curious about how can you build this for yourself? Read on to find out!
Exploratory Research FTW
In one sense this post is a continuation of the research and experimentation that led to my last post Using a Filter Action as a Parameter, namely that when we replicate the data we get more options to work with it. This post is also based on exploration of the all the nooks and crannies in the Tableau interface, in this case how Tableau generates range filters for continuous pills, and the combination of these learnings leads to a new way to control interactivity in the tool.
For example here’s another view where what we want to do is have two independent range filters where the first month of each filtered data set (prior and current) is indexed to 0, the second month to 1, and so on, and then we can can compute a difference between the indexed months:
Ordinarily we’d have to build that with four regular parameters (one each for the top/bottom for each prior & current range) plus one or more calculated fields…whereas with this new technique we can build it more simply and the range of values is completely dynamic.
How the Dynamic Range “Parameter” Works
There are two parts to how this “parameter” works:
- A range filter on a continuous (green) date or number pill that keeps Null values.
- The field that is filtered has a mix of null and non-Null values.
So instead of a standard Tableau parameter we’re actually using one or more range filters that are specially configured.
Range Filters that Keep the Nulls
Here’s a 4 row data set with values of 10, 20, and 30, and Null:

If I add a filter on Value as a continuous (green) dimension pill then I see a range filter:

And that Null value for ID #4 is filtered out. The default for range filters is that they only keep non-Null values.
Now if I edit the filter and click on the Special tab I see the following:

There are three options:
- Null means only include Null values.
- non-Null means only include non-Null values.
- All is the default setting that would include Null and non-Null values, however it’s not actually active until we click Apply or OK.
So at this point all I need to do is click Apply or OK and now the filter keeps the Null Value for ID #4. Have a play with this view and you can see that no matter how you set the range filter the Null value is still kept in the view.
So the method for adding a range filter that keeps the Nulls is:
- Add the continuous pill to Filters. The Filter window will appear.
- Click on the Special tab.
- Click OK.
Here’s a GIF to demonstrate:

Now that I’ve introduced range filters that keep the nulls, what if my data doesn’t have any nulls? There are two use cases I’ll go through:
- Creating a Null with calculated fields
- Creating a Null via union
Creating Null Values with Calculated Fields
Here’s data from Tableau’s Superstore sample data that has all the months in 2014, 2015, and 2016:

In this case we’ll set up independent filters on 2015 and 2016 using the following two calculations:
2015 Filter:
IF YEAR([Order Date]) = 2015 THEN [Order Date] END

2016 Filter:
IF YEAR([Order Date]) = 2016 THEN [Order Date] END
In the view we can see that the calcs are either returning a date value or Null:

With the ignore Nulls’ capability for range filters we can then filter 2016 independently from 2015, like this this view that has the independent date filters while still keeping 2014 data.
This is the key technique for creating the prior/current view with independent date range filters shown earlier.
Creating Null Values with a Union
This next method uses a similar technique to that used in the Filter Action as Dynamic Parameter post where we replicate the data in the Tableau data source to create more values that can be filtered out, and with calculated fields detect what has been filtered out and use those filtered for values like a parameter, as in the view at the beginning of this post.
We can use a regular Tableau union (for supported data sources), the scaffold source technique from my Cross Data Source Joins + Join on Calcs = UNION Almost Anything in Tableau v10.2 post, or the outer join to union technique that Sarah Battersby described in her Dual Axis Mapping – Many Ways post. All of these give us two sets of data that we can access independently of one another.
For this example I’m going to use the outer join technique because it makes the views a little easier to set up, here’s a three row data set that has been unioned to itself with the outer join:

Here’s a workout view that shows how we can filter for one copy but not the other:

Then depending how we want to build out a view we can use a variety of methods to identify the selection status of the marks and display them. You’ll need to keep in mind Tableau’s order of operations, in particular:
- If you are using a dimension filter then you can use an aggregate measure to detect the selection status. For example in this view I’m using COUNTD([Copy]) where Copy identifies which copy of the data to identify the selection status:

- If you need to filter on an aggregation then you’ve got a couple of options, the first one is to use a FIXED LOD expression to perform the aggregation and then return the result as a dimension and use that as the filter, like in this view below:
 There is extra complication here that any other dimension filters would need to be added to Context to affect the LOD dimension-based range filter. Also the quick filter display doesn’t show the range of values in the same way that an aggregate-based range filter does.
 - The second option when filtering on an aggregation is to then use a table calculation to identify the selection status. This gets more complicated because we need to increase the viz level of detail (vizLOD) for the table calculation to support the table calculation, the advantage is that we can get a really dynamic range filter. Here’s a screenshot of that view, though with this data set the range filter doesn’t show these options:

The Consumer Sales Threshold view that started out this post uses the table calculation method to identify the selection status and there we can see the aggregate range filter in action:

Conclusion
The ultimate reason for building this dynamic range “parameter” in Tableau is to improve the user experience with a little effort to create extra calculations and perhaps more data preparation. And, of course, we can still encourage Tableau to make it easier to do these kinds of things by voting them up on the ideas forum and telling every Tableau staff member we meet we can about our requirements!
Here’s a link to the dynamic range parameter workbook on Tableau Public.
Thanks for the post Jonathan! Really appreciate the thorough documentation on this technique and all the screenshots and examples- well explained! I’ve found myself starting to explore the APIs much more because of the limits within the tool.
Well, this is sheer wizardry. Brilliant. Thanks!
I learned something new from your post. Thanks for that!
Anyway, i downloaded your workbook and am curious on how you managed to sort in ‘independent measure filters w/TC’ worksheet.
I’ve done many researches but couldn’t find one.
What i do is a ‘nested’ sort, while yours is by ‘field’.
Hi,
I suspect the difference is a versioning issue…nested sorts were introduced in the last couple of years and have gone through several changes over time. I can’t actually generate the original field sort from scratch either when using v2019.2.
Jonathan
Maybe this was covered, but how did you create the range filter in the first place? Thank you!
Hi Rob,
Sorry for the delay in replying, comments on my site were borked. Tableau generates range filters for continuous (green) fields on Filters, so if you have a discrete (blue) date you can right-click on it to make it a a continuous and Tableau will automatically give you different filter options.