Monthly Archives: October 2012

Partitioning by Table Calculations

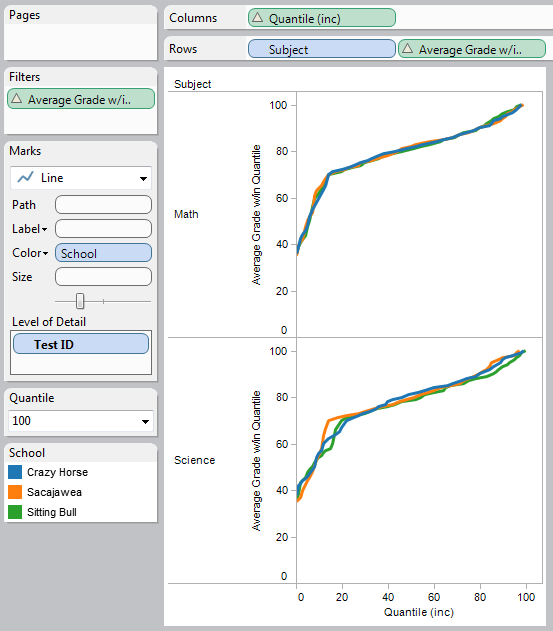
Here’s a issue on the Tableau forums that shows up at least once per month or so: someone has a data set that they want to compute a measure over, and the measure requires table calculations. Then they want to use the results of those calculations as a discrete value for partitioning other calculations. For example, given a set of student grades, compute each student’s percentile, then show the average of each percentile in the same view. Or a similar idea, only the percentile is based on sum of sales, and you want to show the top 10% and bottom 10% of sales. Continue reading

Pie (Charts) in the Sky

Shawn Wallwork has a knack for starting some interesting (to me, at least) threads on the Tableau forums – like this one about the forums themselves. He posted an idea yesterday for Tableau changing the layout container paradigm for dashboards to more of a canvas GUI like other tools, and invited folks to submit their paradigm-shifting ideas. I got just a wee bit pie in the sky in my response, check out the Change to a ‘Canvas’ GUI thread for a dose of a potential future where views can be flipped from screen to screen and rearranged with the same ease of use that we have when we swipe to unlock our phones.

Older But Still Useful – Conditional Formatting

Back in May of this year before I started this blog, I did a presentation at the Boston Tableau User Group on conditional formatting in Tableau. Prior to using Tableau, I’d created some dashboards and reports in Excel, and when I tried to re-create them in Tableau I ran into a number of different issues in terms of doing the kinds of formatting, layout, and conditional formatting that are possible in Excel. I created a workbook with every technique I could find and some I figured out. Continue reading

Unexpected Results: Rounding

When using Tableau with different data sources, it becomes obvious fairly quickly that there are differences in what functions are available in one data source vs. another. For example, MEDIAN() and COUNTD() are functions not available in MS Excel, Access, or text data sources, but are available in Tableau Data Extracts and many others. This post goes into a case where the same function is available, but is returning different results than we might expect depending on context, and introduces a workaround. Continue reading

Formatting Geekery – Special Values in a Text Table

When faced with a stubborn Tableau problem, I’ll get a little OCD thing going and won’t quit until I’ve opened up a couple dozen browser tabs from searches and exhausted every avenue I can think of. This leads to success often enough that like a Pavlovian animal I keep up the behavior, even when I’d probably be better off taking a break to do something like exercise, connect with another human being, eat, look out the window at nature, drink, see my family, sleep, that sort of thing. The following is the result of one of those efforts: Continue reading